System Hierarchy
In XFMEA/RCM++, the flexible system hierarchy allows you to manage large, multi-level system configurations with as many levels as you need and any number of items per level. You can fully define the properties for each item (e.g., supplier, part number, expected operating environment, etc.) and perform relevant analyses for selected items.
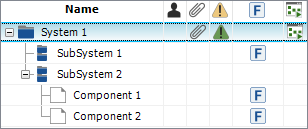
The hierarchy will consist of systems, subsystems and components, and you can perform a variety of analyses at any level in the configuration. (See Building the System Hierarchy.)
System Hierarchy Filtered View
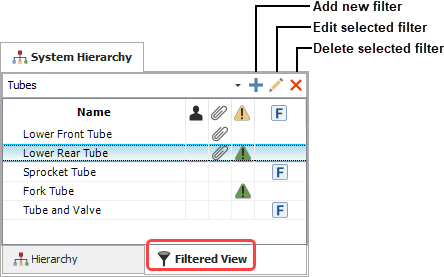
On the Filtered View tab of the System panel, you can also select or create an item filter to find and focus on the specific items of interest. Records meeting the filter criteria are presented in a sortable list.
System Hierarchy Columns
To hide or display system hierarchy columns, or change the column order, right-click the column headings then click Customize Columns. (You can also change the column order by dragging and dropping column headings into the desired positions.) These settings are stored per computer/username in the System Hierarchy page of the Application Setup. Any project that you open on this computer will have the same columns displayed, but other users may have different display preferences.
The following columns are available:
- # displays the record position number assigned by the software based on the position of the item in the system hierarchy. For example, if you insert a new item above an existing item, then the new item will take the number of the existing item and all items below it will be renumbered. Likewise, if you delete an item, all items below it will be renumbered automatically.
- Name displays the item name. This is a required field, and it is specified on the Properties tab of the Analysis panel.
- Record ID displays a unique identifier assigned by the software. The record ID is unique among all system hierarchy items that are defined in the database. It can also be used in the Query Utility to help identify a specific item that may share the same name with another item.
- User Access displays status
indicator when the record is in use (
 )
or when it is restricted to selected users (
)
or when it is restricted to selected users ( ).
). - XFRACAS Associated Hierarchy Item is available for enterprise databases only. It indicates that the item is associated with an XFRACAS hierarchy item. If an association exists, future changes made to the item and/or its failures and causes in XFRACAS can be brought into the software by synchronizing the data.
- Reference Number displays the reference number associated with the item. To display this column in the current project, the field must be enabled on the Item > Properties page of the interface style. The number is specified on the Properties tab of the Analysis panel. Tip: If you wish to automatically generate reference numbers (e.g., 1.2.1) for all items based on their positions in the hierarchy, choose System Hierarchy > Tools > Renumber All Items and then select the Apply to reference number field check box. This cannot be undone.
- Part Number displays the part number associated with the item. To display this column in the current project, the field must be enabled on the Item > Properties page of the interface style. The number is specified on the Properties tab of the Analysis panel.
- FMEA Document Number displays the document number for the local FMEA associated with the item, if any. To display this column in the current project, the field must be enabled on the FMEA > Header page of the interface style. This number is specified on the Header tab of the FMEA, if there’s an FMEA defined for the item.
- Attachment displays
a paper clip icon
 if one or more files
have been attached to
the corresponding item.
if one or more files
have been attached to
the corresponding item. - Flag displays a flag for the item, if desired. The available flags are: Complete (indicated by a green flag), In Progress (indicated by a yellow flag) and Incomplete (indicated by a red flag). In all ReliaSoft applications, flags are displayed in the interface only and do not affect analysis results or reports.
- Item SxO displays the calculated rating from the Item Severity x Item Occurrence (if enabled for the project). If a risk ranking logic is defined for the project, the value will be color-coded based on the specified risk criteria.
- Item Risk displays the calculated risk ranking logic value for the item, if it is defined for the project.
- Risk Discovery displays
an icon if a risk
discovery analysis has been performed on the item. If
the analysis indicates that the item requires more detailed
investigation, the icon will be red
 ;
otherwise, the icon will be green
;
otherwise, the icon will be green  .
. - Risk Discovery Details displays
a number if a risk discovery analysis has been performed on
the item.
- If the analysis uses risk discovery questions, then this cell will display the number of questions with "Yes" answers. More "Yes" answers indicates greater risk.
- If the analysis uses risk discovery ratings, then this cell will display the calculated value of all categories, which is based on the method in use for the Risk Discovery Ratings used in the project. Higher values indicate greater risk.
- P-Diagram displays
 if a Parameter
Diagram (P-Diagram) has been created for the item,
if a Parameter
Diagram (P-Diagram) has been created for the item,  when a P-Diagram
change log is present and a revision is in progress
or
when a P-Diagram
change log is present and a revision is in progress
or  when a
P-Diagram change log is present and no revision is active.
when a
P-Diagram change log is present and no revision is active. - Analysis Plan
displays
 if an
Analysis Plan has been created
for the item.
if an
Analysis Plan has been created
for the item. - Process Flow Diagram
Worksheet displays
 if a PFD
worksheet has been created for the item.
if a PFD
worksheet has been created for the item. - FMEA displays
 if an FMEA has
been created for the item,
if an FMEA has
been created for the item,  when an FMEA
change log is present for the local FMEA and a revision
is in progress or
when an FMEA
change log is present for the local FMEA and a revision
is in progress or  when an FMEA change log is present for the local FMEA and
no revision is active. In addition, this column may indicate
the status of the associations with all source records. (See
Ancestry for more information about
source records and the situations in which they can be used.)
Green
when an FMEA change log is present for the local FMEA and
no revision is active. In addition, this column may indicate
the status of the associations with all source records. (See
Ancestry for more information about
source records and the situations in which they can be used.)
Green  indicates that no source records
have been changed either since their descendants were created
or since the last time a change notification for the descendants
was dismissed. Orange
indicates that no source records
have been changed either since their descendants were created
or since the last time a change notification for the descendants
was dismissed. Orange  indicates that some change has been made to one or more source
records or their dependents, or that one or more source records
have been deleted.
indicates that some change has been made to one or more source
records or their dependents, or that one or more source records
have been deleted. - DRBFM displays
 if a design
review based on failure mode (DRBFM) analysis has been
created for the item.
if a design
review based on failure mode (DRBFM) analysis has been
created for the item. - Test Plan displays
 if a test plan
analysis has been created, for the item,
if a test plan
analysis has been created, for the item,  when a test
plan change log is present and a revision is in progress
or
when a test
plan change log is present and a revision is in progress
or  when a
test plan change log is present and no revision is active.
In addition, this column may indicate the status of the associations
with all source records. (See Ancestry
for more information about source records and the situations
in which they can be used.) Green indicates
that no source records have been changed either since their
descendants were created or since the last time a change notification
for the descendants was dismissed. Orange
indicates that some change has been made to one or more source
records or their dependents, or that one or more source records
have been deleted.
when a
test plan change log is present and no revision is active.
In addition, this column may indicate the status of the associations
with all source records. (See Ancestry
for more information about source records and the situations
in which they can be used.) Green indicates
that no source records have been changed either since their
descendants were created or since the last time a change notification
for the descendants was dismissed. Orange
indicates that some change has been made to one or more source
records or their dependents, or that one or more source records
have been deleted. - DVP&R displays
 if a design
verification plan and report (DVP&R) analysis has
been created for the item,
if a design
verification plan and report (DVP&R) analysis has
been created for the item,  when a DVP&R
change log is present that a revision is in progress or
when a DVP&R
change log is present that a revision is in progress or
 when a DVP&R
change log is present and no revision is active.
when a DVP&R
change log is present and no revision is active. - Control Plan
displays
 if a control plan analysis
has been created for the item,
if a control plan analysis
has been created for the item,  when a control plan change log is
present and a revision is in progress or
when a control plan change log is
present and a revision is in progress or  when a control plan change log is present and no revision
is active. In addition, this column may indicate the status
of the associations with all source records. (See Ancestry
for more information about source records and the situations
in which they can be used.) Green indicates
that no source records have been changed either since their
descendants were created or since the last time a change notification
for the descendants was dismissed. Orange
indicates that some change has been made to one or more source
records or their dependents, or that one or more source records
have been deleted.
when a control plan change log is present and no revision
is active. In addition, this column may indicate the status
of the associations with all source records. (See Ancestry
for more information about source records and the situations
in which they can be used.) Green indicates
that no source records have been changed either since their
descendants were created or since the last time a change notification
for the descendants was dismissed. Orange
indicates that some change has been made to one or more source
records or their dependents, or that one or more source records
have been deleted. - Process Flow Diagram
displays
 if a graphical process
flow diagram has been created for the item.
if a graphical process
flow diagram has been created for the item. - FMEA Block Diagram
displays
 if an FMEA
Block Diagram has been created for the item.
if an FMEA
Block Diagram has been created for the item. - Cause and Effect Diagram
displays
 if a cause and effect
diagram has been created for the item.
if a cause and effect
diagram has been created for the item. - QCPNi and QCPNr display the calculated initial and revised Quantitative Consequence Priority Numbers. To display these columns in the current project, the fields must be enabled on the FMEA > RPNs page of interface style.