Parameter Diagrams (P-Diagrams)
A Parameter Diagram (P-Diagram) is a structured tool that identifies the inputs to a system and relates those inputs to the desired system outputs, while considering the controlled and uncontrolled factors. It is useful in brainstorming and documenting, and helps the FMEA team understand and make visible the robustness of the design that is being analyzed. It can provide important input to System and Design FMEAs.
What's Changed? Starting in Version 2020, three additional elements were made available for inclusion in P-Diagrams: Function, Functional Requirements and Non-Functional requirements. These elements are intended to allow users to follow the AIAG & VDA FMEA Handbook released in 2019. You can enable/disable them in the project's interface style.
Add a P-Diagram
To add a P-Diagram for any item in the system hierarchy, select or right-click the item and choose Analyses > Add P-Diagram.
![]()
The P-Diagram tab will open in the Analysis panel. In addition, the P-Diagram icon will appear in the corresponding column in the System Hierarchy tab of the System panel (if that column has been selected for display on your computer).
Enter the Data
The P-Diagram tab provides input boxes for the elements that are typically recorded in this type of analysis. (Refer to P-Diagram Elements for more information about what to enter for each element, and opportunities to share specific inputs and outputs with other relevant analyses.) You can type directly into the rows for each input box, and use the ribbon commands to insert a row, delete a row, or move a selected row up or down in the list.
Select Existing Text
There are two ways to use the Select Existing Text window to copy and reuse text from existing P-Diagrams or other relevant analyses:
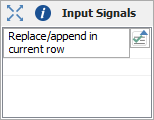
- Replace or append text in the current row - If you click the icon inside a row in one of the input boxes, the utility will either replace the current text in that row, or append text to the end of the current description.
- Create one or multiple new rows - If you click the command in the P-Diagram tab of the ribbon, the utility will create a new row for each description that you select.
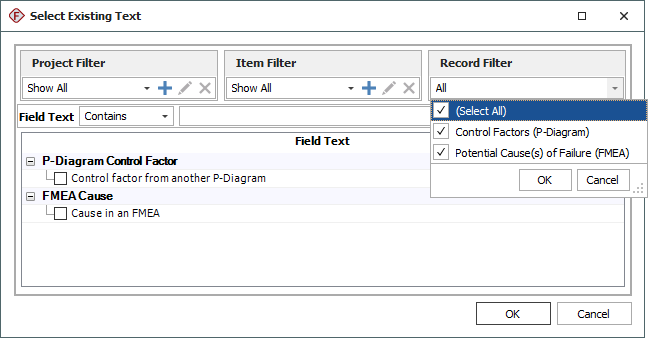
In both cases you can use the filters at the top of the window to specify which descriptions are displayed. The following example shows the options for creating new rows in the Control Factors input box. For this type of input, you can select control factors from existing P-Diagrams or causes from existing FMEAs.
Import Elements from Excel
If you have the text elements in an Excel file, you can right-click the P-Diagram analysis tab in the Analysis panel and choose Import from Excel.
![]()
You can then select an Excel file and import the data from Excel. If a P-Diagram does not already exist, then one is created. If a P-Diagram already exists, then the new records are added to the end of the affected elements.
Reports and Queries
To generate a report of the P-Diagram, choose Home > Reporting > Reports to open the Reports window.
![]()
Select the system hierarchy item and then select any of the predefined or custom reports under the P-Diagram heading. (For custom reporting needs, see XFMEA/RCM++ Report Templates.)
To query P-Diagram data, choose Home > Reporting > Queries to open the Query Utility.
![]()
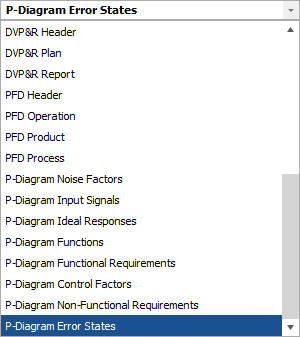
Select any of the P-Diagram elements from the drop-down list.