 Create
the project and set project properties
Create
the project and set project properties
Choose Project >
Management > Create Project.

In the Project Properties window, specify the FMEA Structure and the
Profile that will
be used to set the configurable settings.
(See Choosing
the FMEA Structure
and Profiles.)

- Add
items in the system hierarchy
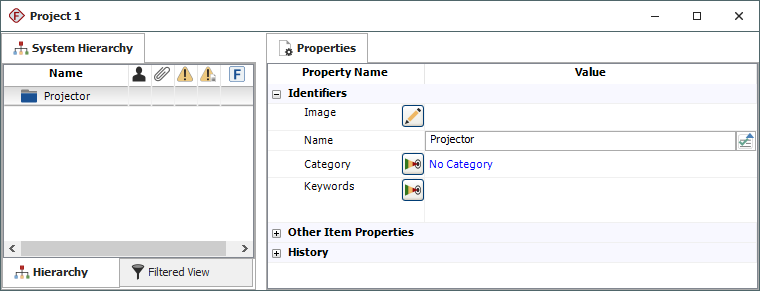
The first item is added to the system hierarchy when
you create the project. Use the Properties tab in the
Analysis panel to rename it and set other properties.
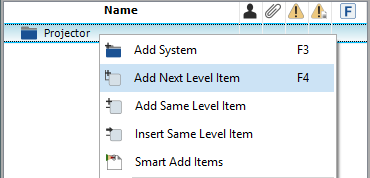
To add items, right-click inside the system hierarchy
and choose Add System,
Add Next Level Item,
etc. (See
Building the System
Hierarchy.)
- Add
a new FMEA
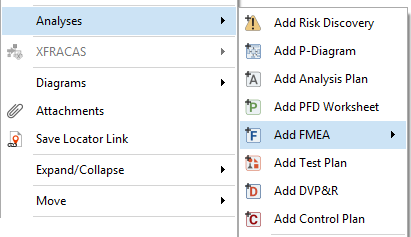
To add an FMEA for an item, right-click the item in
the system hierarchy and choose Analyses
> Add FMEA.
- Add
records in the FMEA hierarchy
The Hierarchy
tab for an FMEA displays the analysis records in a
hierarchical tree, which tends to be good for viewing
a lot of information in a small amount of space. In this
view, you will use properties windows to add or edit FMEA
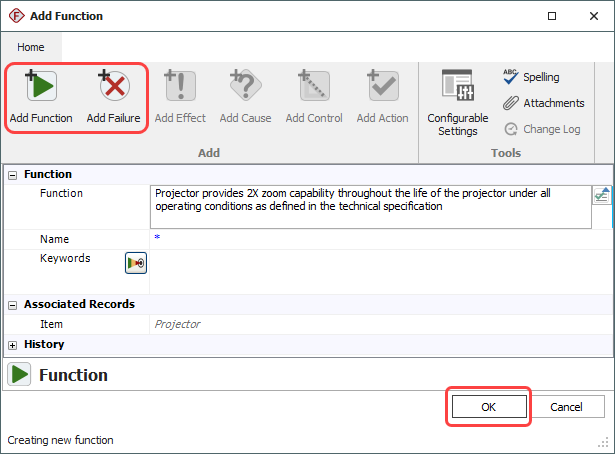
records.When you add a new FMEA, the Function window will automatically
open. Enter the details and click either Add
Function (to add the next function description),
Add Failure (to
add the first failure mode for this function) or OK (to close the window).
- Use
Select Existing Text utilities
The Select Existing Text window
provides a list of existing descriptions that might apply
to the current text field or analysis. (See
Select Existing Text
Window.) If you want to use this utility to replace or append
text in an input field, click the icon next to the field.

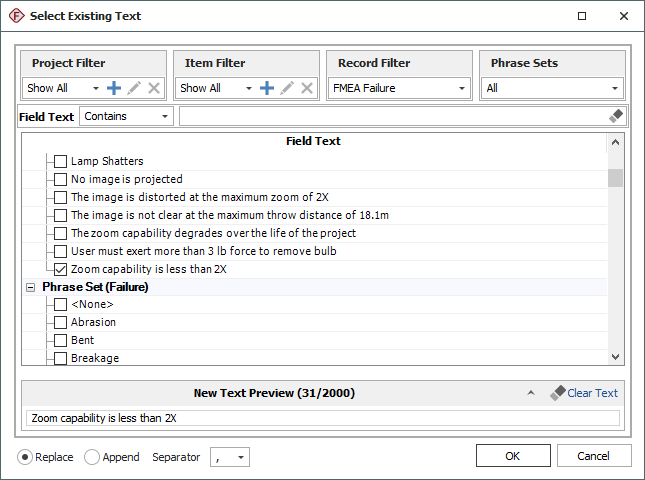
The Select Existing Text window
can also be used to add multiple records at once. For
example, right-click a function record and choose Add Multiple Failures >
Select Existing Text.
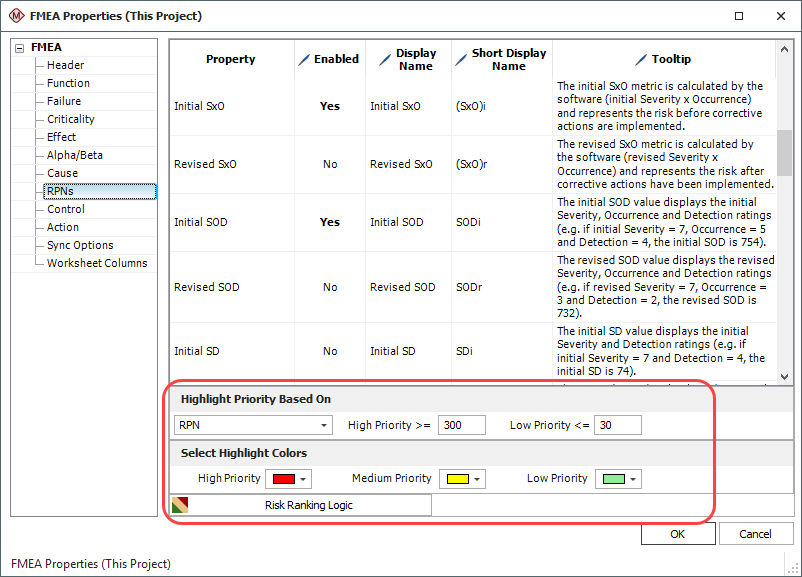
- View
RPNs and related metrics
You can choose to calculate and display a variety of
metrics based on the Severity, Occurrence and Detection
ratings that have been assigned for effects and causes
in the FMEA: RPN, SxO, SOD, SD or QCPN.
(See RPNs and Related
Metrics.) To configure the metrics that are enabled for the current
project, choose FMEA
> Tools > Configurable Settings.

On the RPNs page, use the Enabled column to specify
which metrics will be available in the current project. Use the Highlight Priority
Based On area to configure the logic that will
be employed when a user turns on the priority highlights
feature.
(See FMEA > RPNs.)
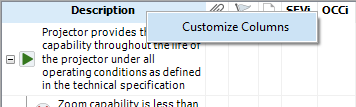
To choose which metrics will be displayed in the FMEA
hierarchy for your computer, right-click a column heading
in the FMEA and choose Customize
Columns.
To turn on priority highlighting, choose FMEA
> Tools > Highlight Priority.

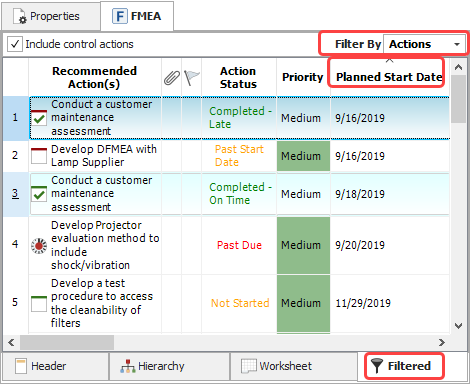
- Use the filtered and worksheet views
- Filtered
view
Click the Filtered tab at the bottom of the FMEA
to open the filtered view. This view presents a sortable
list of all records of a particular type, such as
causes sorted by RPN or actions sorted by due date.
(See FMEA Filtered View.) Use the Filter
By drop-down list to select which records are
displayed. Then click inside the column heading you
wish to sort by.
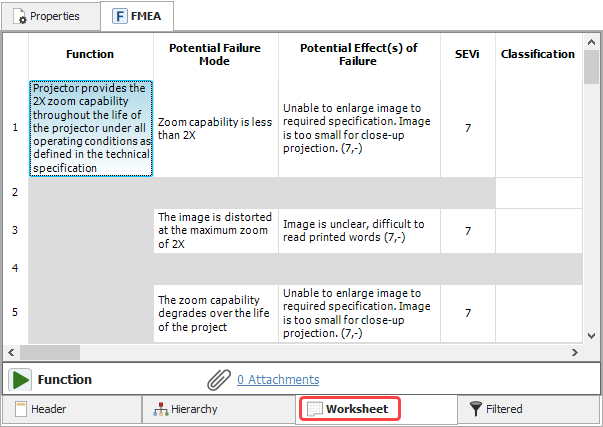
- FMEA
worksheet
Click the Worksheet tab at the bottom of the FMEA
to open the worksheet view. This view allows you to
type directly into the worksheet cells and tab through
the analysis as you would in a spreadsheet application.
(See FMEA Worksheet.)
To use the entire workspace for the worksheet view,
choose View >
Workspace Layout > Hide System Panel.

To return to a split workspace, choose View
> Workspace Layout > Split Panels.

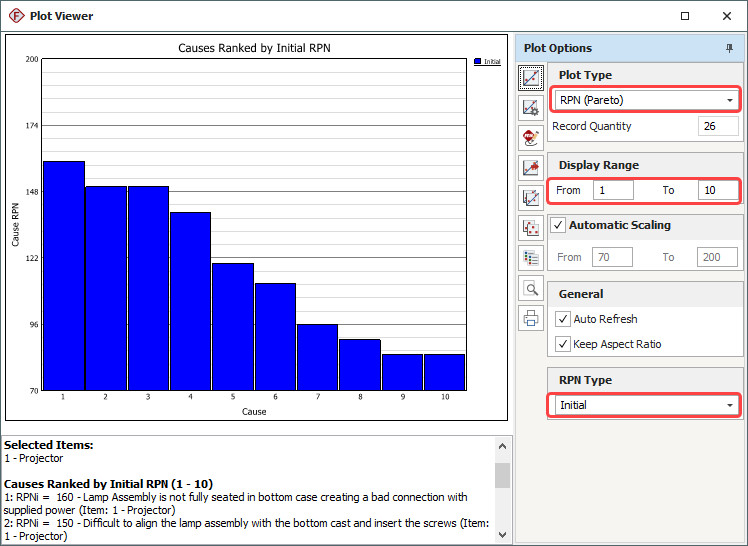
- Create
plots
Choose Home > Reporting
> Plots.
(See FMEA Plots.)

Select the item(s) that you want to include in the plot.
Then use the control panel to select the plot type and
other settings.
- Run
a query
Choose Home > Reporting
> Queries.
(See Query Utility.)

First use the left panel to specify the data source
(selected projects throughout the database or selected
items within the current project). Then use the right
panel to specify the query criteria and output preferences.
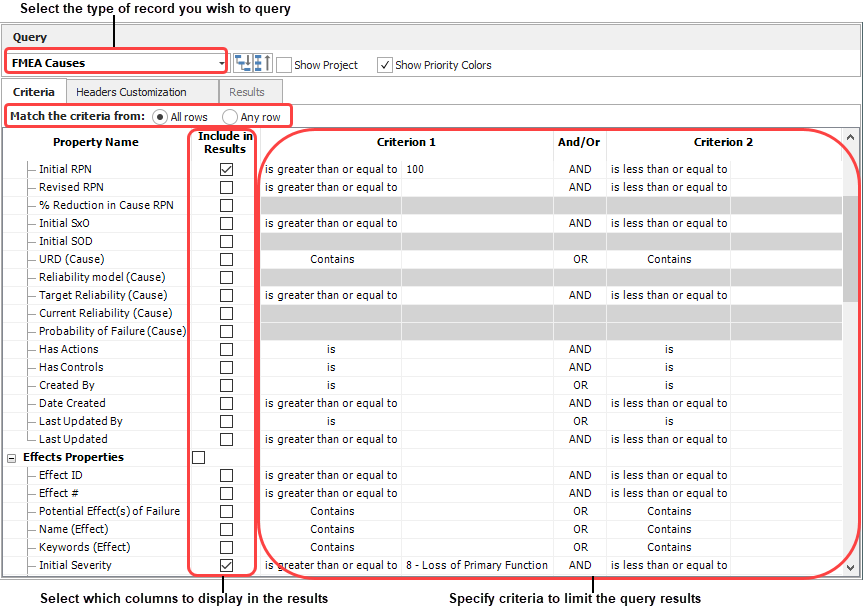
Click Run Query
to view the records that match the criteria.
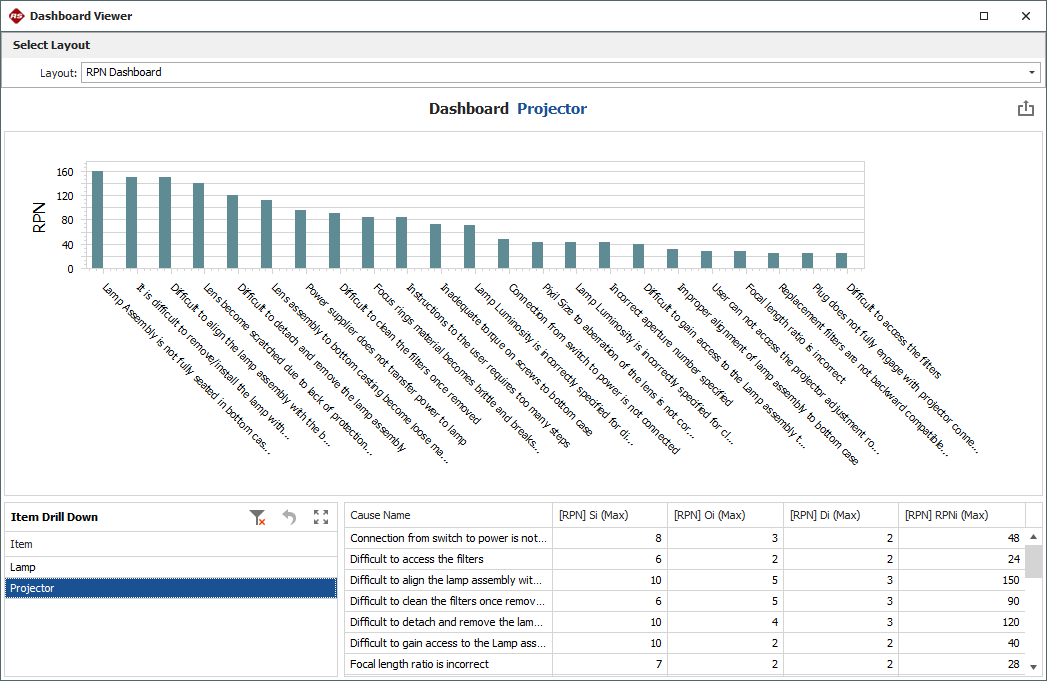
- View
a dashboard
Choose Home > Reporting
> Dashboard > Dashboard Viewer.
(See FMEA Dashboards.)

In the Layout
drop-down list, select one of the layouts that have been
predefined for FMEA data and then use the dashboard to
view the desired information. For example, in the RPN
Dashboard you can click an item in the Item
Drill Down panel to select which item’s data will
be displayed in the other 2 panels.
- Generate
a report
Choose Home > Reporting
> Reports.
(See Reports Window)

Select the items that you want to create a report for,
the report forms you want to include in the generated
report and the desired output type (Excel or Word).
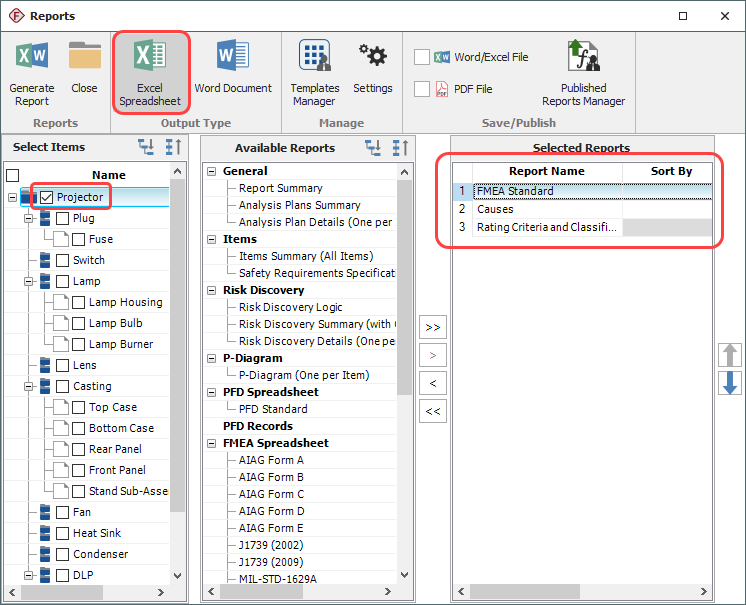
Click Generate Report
to create the report.
 Using FMEAs