FMEA Hierarchy
The Hierarchy tab for an FMEA displays the analysis records in a hierarchical tree, which tends to be good for viewing a lot of information in a small amount of space. It can be especially useful when copying and pasting data or when scanning the analysis to find a particular section of the FMEA.
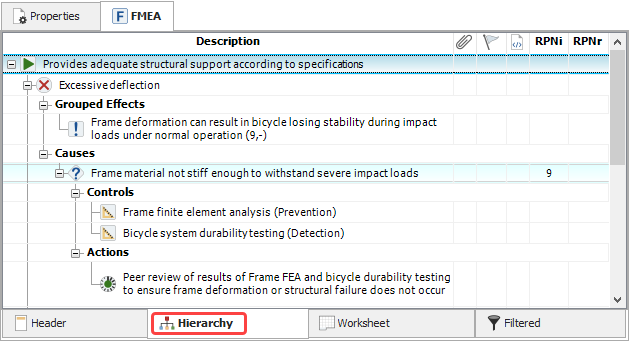
Double-click a row to open its properties window. If you click another row while the properties window is still open, it will automatically update to show the current selection.
To access other relevant commands (add, insert, copy, paste, etc.), right-click inside the hierarchy or use the FMEA tab on the ribbon. The options depend on which record (or heading) is currently selected. (See FMEA Tab for a complete list.)
To move a record up or down in the list, drag and drop the row to the desired location, or select the row and choose Home > Move Record > [Up or Down].
![]()
![]()
FMEA Hierarchy Columns
To hide or display columns, right-click the column headers in the FMEA hierarchy view, then click Customize Columns to select which columns you want to display. These settings are stored per computer/username in the FMEA Hierarchy page of the Application Setup, so any project that you open on this computer will have the same columns displayed.
The available columns include the following:
- # is assigned automatically based on the current position of the record in the FMEA hierarchy. This number will change if the record’s position within the FMEA changes.
- Description is the record description.
- Record ID is assigned automatically when the record is created. It is unique throughout the database for a given record type and it does not change. If you copy/paste or import a record, each new instance will receive its own unique ID.
- Attachment displays
a paper clip icon
 if there are any links or attachments for the record.
 - Flag displays a flag for the record, if desired. The available flags are: Complete (indicated by a green flag), In Progress (indicated by a yellow flag) and Incomplete (indicated by a red flag). In all ReliaSoft applications, flags are displayed in the interface only and do not affect analysis results or reports.
- Ancestry - Source Record
(
 )is available only for descendant records. It indicates the
status
of the association with the source record.
)is available only for descendant records. It indicates the
status
of the association with the source record. - Ancestry - Descendant
Record(s) (
 )
is available only for source records.
It displays the number of descendant records that have been
created from the source record. Double-click the number to
open the View Descendants window.
)
is available only for source records.
It displays the number of descendant records that have been
created from the source record. Double-click the number to
open the View Descendants window. - Classification may be assigned to cause records in order to identify design characteristics that require special manufacturing control (e.g., Critical, Significant, Key Leading, etc.).
- FEC

This displays the abbreviation generated in the Failure Effect Categorization window.
- Observed Occurrences is available only if you are working with an item that has a current association with a part in XFRACAS. It displays the number of incidents, problems or failure analyses recorded in XFRACAS for the failure mode/cause combination. (See Import or Sync from XFRACAS for more details.)
- The following columns for RPN
ratings and/or metrics can be displayed only if the column
is selected in the Customize Columns window and the property
is enabled in the interface
style for the current project. The lowercase letter "i"
indicates an initial rating or metric while the letter "r"
indicates revised.
- S, O and D display the severity, occurrence and detection ratings assigned to the effect and cause records. (Note that in projects using sub-severity ratings, this column displays only the overall severity ratings and will be blank if you have neither assigned nor calculated an overall rating.)
- RPN displays the calculated Severity x Occurrence x Detection.
- QCPN displays the calculated Quantitative Consequence Priority Number.
- SxO displays the calculated Severity x Occurrence.
- SOD and SD combine the ratings into a 3 or 2 digit number. For example, if the severity is 7, the occurrence is 5 and the detection is 6, then SOD = 756 and SD = 76.
- RR displays the risk ranking value for the cause. (See Risk Ranking Logic.)