SEP Web Portal
If your organization implements an SEP web portal for an enterprise database, the entire team — including managers and colleagues who don't have ReliaSoft desktop applications installed — can access key analysis and project details from any web-enabled device.
SEP Dashboards
The personalized home page provides an intuitive, at-a-glance overview of the information you’re tracking via SEP, such as FMEA stats, actions, recent messages, reports, metrics and more. You can choose which tiles appear on your dashboard and change their order and settings. (See SEP Dashboards.)
Actions and Portal Messages
You can use SEP to create, view and edit the same actions and portal messages that are visible to you from the desktop applications. SEP also allows colleagues who don't use the desktop applications to stay up-to-date on assignments and team communication. (See Actions and Messages in SEP.)
Project Summary, Analysis Summaries and Project Plan
For each analysis project that you have permission to view, SEP provides a summary that includes metrics, assigned actions, attachments and other project details. It also displays summaries, plots and reports for selected analyses published to SEP from Weibull++, BlockSim and Lambda Predict.
If your team is using the Project Planner in desktop applications, SEP shows a streamlined view of the project plan. Users can access this plan in SEP and update their progress for assigned actions. (See Projects in SEP.)
System Hierarchies and FMEAs
SEP enables users throughout your organization to view FMEAs, queries and reports that were created in XFMEA or RCM++. This provides managers and others throughout your organization with convenient web-based access to the wealth of lessons learned and troubleshooting recommendations from your investment in these analyses. (See FMEAs in SEP.)
Metrics (Key Performance Indicators)
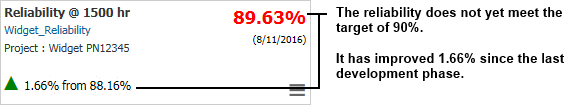
SEP shows all of the KPIs (metric resources) that have been created in desktop applications for the projects you have permission to view; no publishing is required. Quick visual indicators help you monitor performance and support decision making.
Monitored Reports
SEP can display a variety of custom reports and dashboards created in desktop applications. The "Watch" feature makes it easy to manage the specific reports you want to access quickly. (See Reports in SEP.)
SEP also shows all of the Analysis Explorer and Reliability Data Warehouse (RDW) dashboards that have been predefined in the desktop applications.