Metrics
A metric is a resource that provides a flexible way to display any numerical value of interest, and track how it changes over time. This can be used for tracking and displaying a variety of Key Performance Indicators (KPIs) and other values, including:
- Reliability metrics (e.g., reliability, BX% life, etc.) calculated from a model resource.
- Any result from a simulated BlockSim diagram.
- The completion percentage and resource usage for Project Planner gates.
- The reliability or availability calculated from an FMRA in XFMEA/RCM++.
- Any other user-defined value that you wish to display and track.
Like any other resource, you can create or edit metrics from the Resource Manager, and while you’re performing a relevant analysis. (See Showing Metrics in Folios/Diagrams, Using Metrics in Project Planner Gates and Pushing Metrics from an FMRA.)
If your organization chooses to implement an SEP web portal, it's easy to choose specific metrics that you want to access quickly from any web-enabled device.
Note: Metrics are always local resources. They cannot be made global. Metrics in a reference project are local to that project and can't be selected for use in other projects.
Metric Types
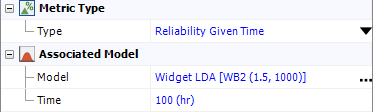
The following pictures demonstrate the four basic options for specifying the value that will be displayed and tracked.
|
Calculate from a model resource
|
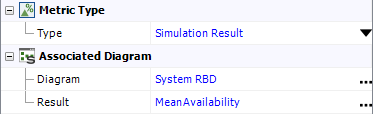
Obtain from a BlockSim simulation diagram
|
|
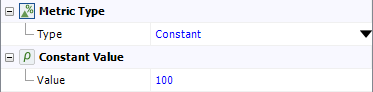
Enter any user-defined value
|
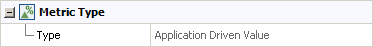
The value is "pushed" from a Project Planner gate or FMRA
|
Calculated Result and Saved Values
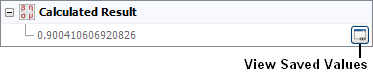
The Calculated Result field shows the latest calculated value for the metric. This will be updated automatically if the associated analysis or model changes, and the latest result will be stored in an array of saved values.
You can then click the View Saved Values icon to view the history of how the metric has changed over time.
If you change any of the properties that affect the way the result is calculated, you will be prompted to decide whether to clear the array of values that were saved before the change. For example:
- If you change the metric from Reliability to Probability of Failure, or from 1,000 hours to 500 hours, you will probably want to clear the array so the timeline of saved values is not misleading.
- Alternatively, if you change the metric’s associated model from prototype1 to prototype2 to prototype3 at different stages of development, you may wish to keep the saved values after each change so the timeline shows the improvement across all three stages.
In the Metric Results Viewer, you can also choose to clear the entire history or delete only a particular saved value.
The results viewer also allows you to copy the values to the Clipboard so you can paste into another application. For example, if the metric stores the calculated reliability at different points in time, you may wish to analyze the data with a reliability growth model in a growth data folio.
- Copy > All rows (dates) copies the exact dates shown in the table.
- Copy > All rows (cumulative days) replaces the dates with the cumulative number of days since the date of the last saved value. For example, if the first date is 1/1/2019 and the second date is 12/31/2019, the cumulative days would be 0 for the first date and 365 for the second date.
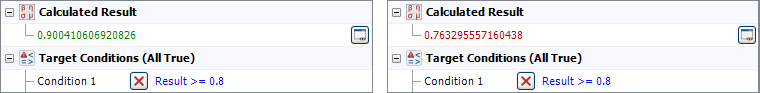
Target Conditions and Result Indicator
The Target Conditions feature color-codes the current value of the metric. If all specified conditions are met, then the metric's value will be displayed in green. If one or more conditions are not met, then it will be in red. For example, in the following pictures, the result is green if the estimated system reliability is at least 80%, and red if it is not.
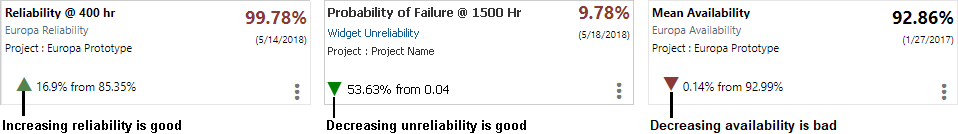
The Result Indicator feature color-codes the indicator that shows whether the value has increased or decreased since the prior saved value. If the direction of the change is desirable, the indicator will be green; if it is undesirable, the indicator will be red. As an example, the following pictures are from the SEP.
Identifiers, History, Watch and Trace Usage
As with most other resources:
-
Identifiers contains additional identifying information that can be used to search for this resource.
-
History provides information about when the record was created and last updated. If the history log has been activated at the project level, you can click the View Item History icon to open the Record History Log for the record.
![]()
-
Watch allows each individual user to subscribe to receive an alert (via e-mail, SMS text message or portal message) when the resource is changed.
-
Trace Usage. For existing resources, the link at the bottom of the window indicates how many times the resource is currently being used. If you need more information, click the link or the icon to open the Dependency Viewer.
![]()