Using Metrics in Project Planner Gates
There are two ways to utilize metrics in a Project Planner gate:
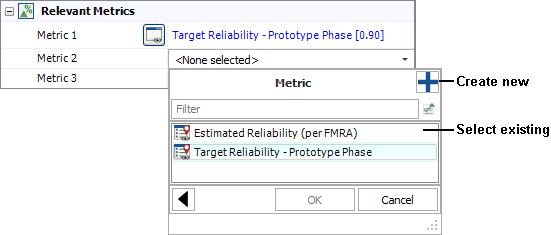
Relevant Metrics
For any gate in a project plan, you can choose to display up to three metrics that are relevant to this stage of the project (e.g., the target reliability, the latest calculated reliability, etc.).
Use the fields under the Relevant Metrics heading to select an existing metric or create a new one.
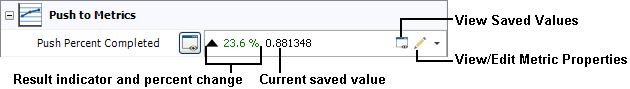
Push to Metrics
For any gate in a project plan, you can also choose to push any of the following values to a metric resource. This makes it easy to see the history of all saved values, and enables users to subscribe to receive alerts when the metric changes. You can also choose to show this information in the SEP web portal if it is implemented for the current database.
- Percent Completed is the percentage of the total duration of dependent actions/gates that is complete. For example, if Action 1 (duration = 3 days) is complete and Action 2 (duration = 1 day) is incomplete, the progress is 75%.
- Actual Man Hours % is the percentage of planned hours that have been used to complete the gate.
- Actual Costs % is the percentage of the budget that has actually been used to complete the gate.
Use the fields under the Push to Metrics heading to create a new metric or select an existing metric that is not already assigned to receive a pushed value. (Note that only unused metrics are shown in this list.)
When you first assign a metric in one of these fields, the current value will be automatically saved to the metric. Subsequently, the value will be recalculated each time an associated action or gate is changed. If the value is found to have changed, it will be saved to the metric. To see the current saved value, click inside the field. This will also display a result indicator and the View Saved Values icon, which you can click to see a history of all saved values.