Using Fault Trees
BlockSim's fault trees can be configured as analytical diagrams (which use the exact algebraic equation for the system model but impose limitations on what can be modeled and what results can be obtained) or simulation diagrams (which provide more modeling options and results but must be analyzed with discrete event simulation).
Fault trees and reliability block diagrams (RBDs) can be used together in the same analysis (e.g., a subdiagram block in a fault tree can point to an RBD and vice versa).
The basic steps for using an analytical fault tree are:
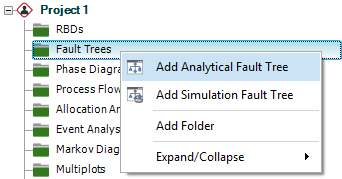
 Add
fault tree diagram
Add
fault tree diagram
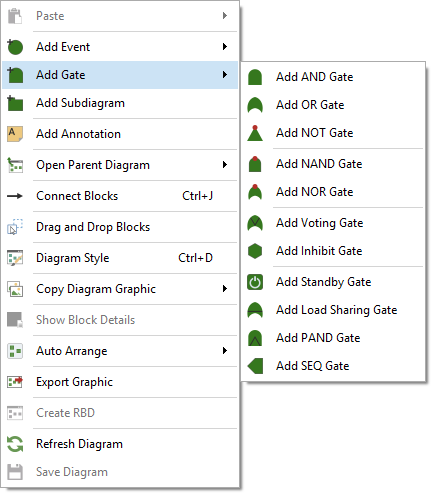
- Add
gates
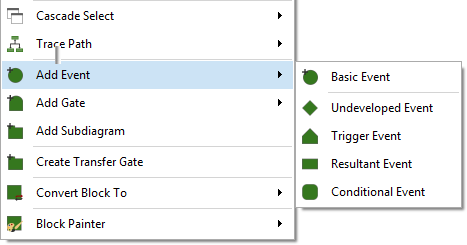
- Add events
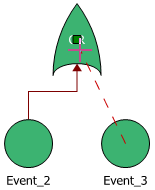
- Connect blocks (if applicable)
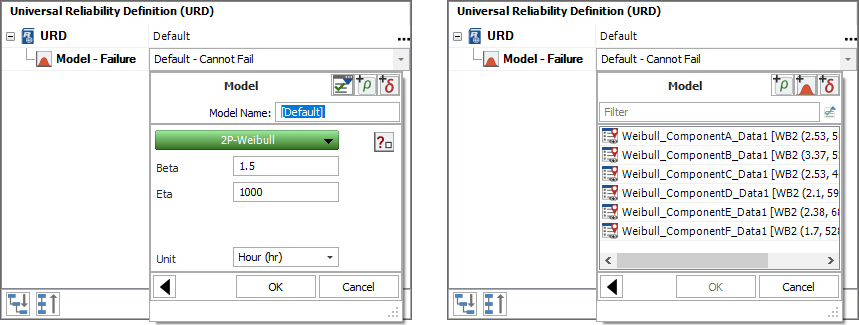
- Set block properties
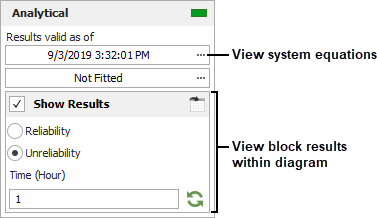
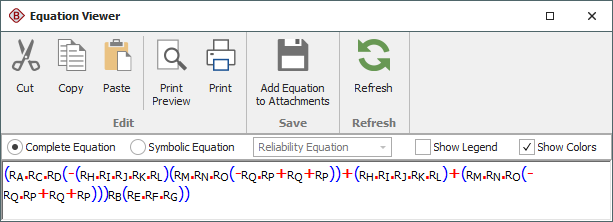
- Analyze the diagram
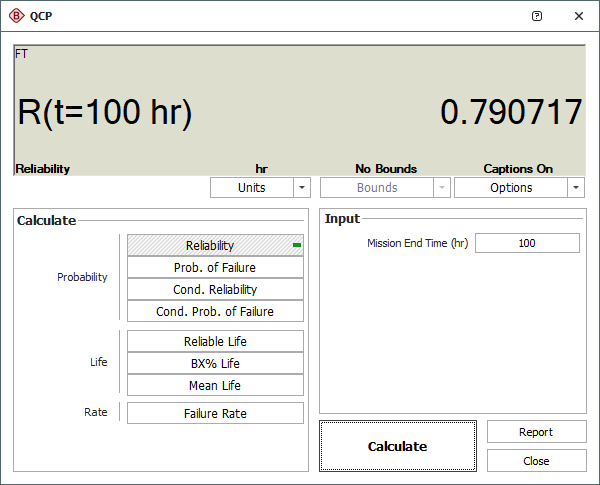
- Calculate metrics
- View plots