 More Analyses and Tools
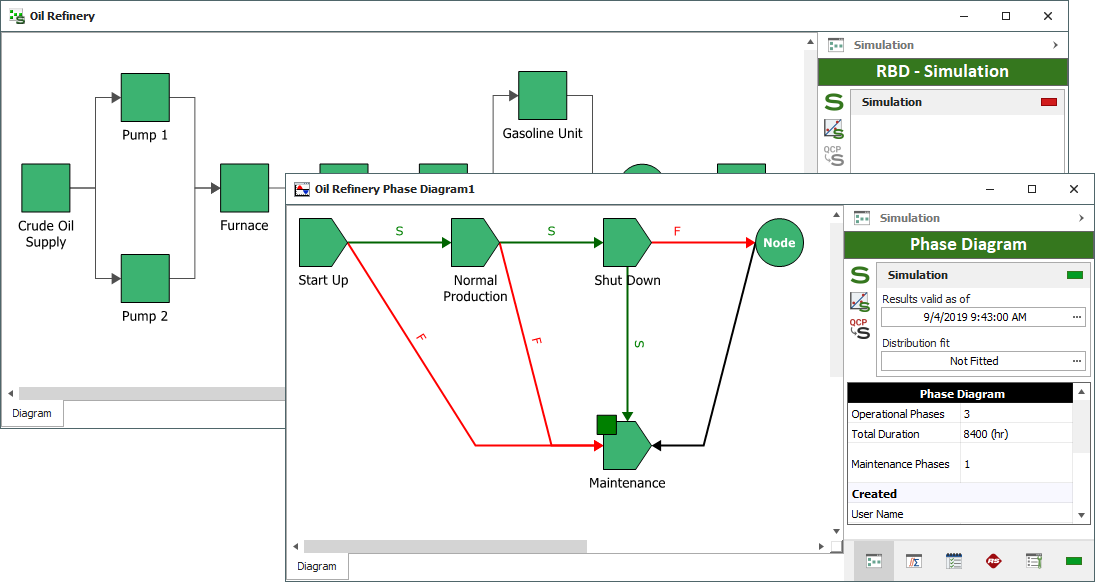
Phase Diagrams
Reliability phase diagrams represent scenarios in which a system may undergo changes over time.
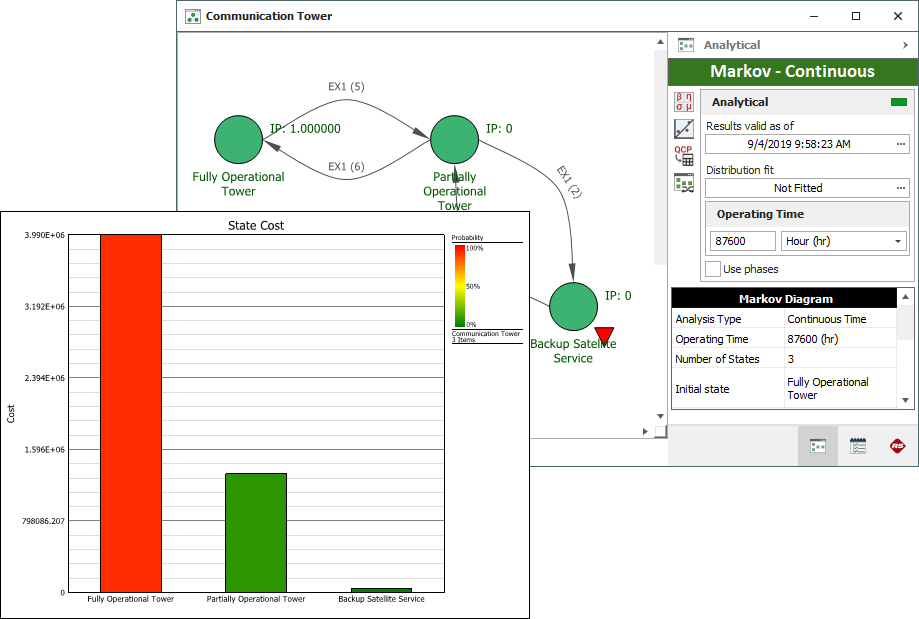
Markov Diagrams
Markov diagrams model the behavior of systems based on memoryless transitions between states, allowing you to look at partial or degraded working states, and to start analysis in varying states.
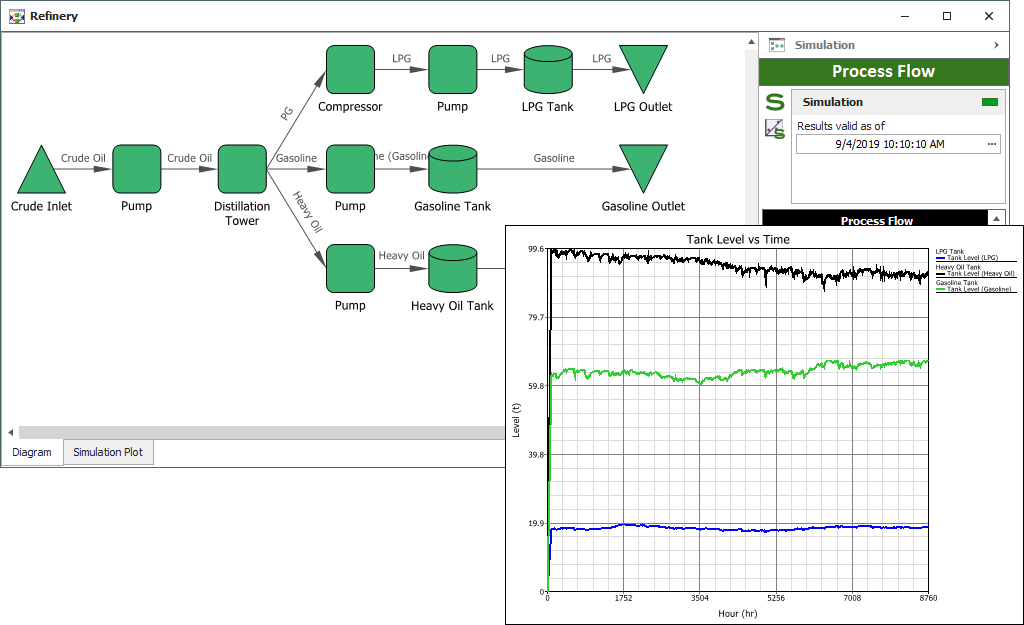
Process Flow Simulation Diagrams
A process flow simulation diagram is used to model a continuous process flow, typically a fluid flow, using a diagram in which the components are connected in flow-wise configuration. The simulation can be used to estimate the amount of raw material consumed by the process, as well as the amount of finished product and waste generated by the process in a given time frame.
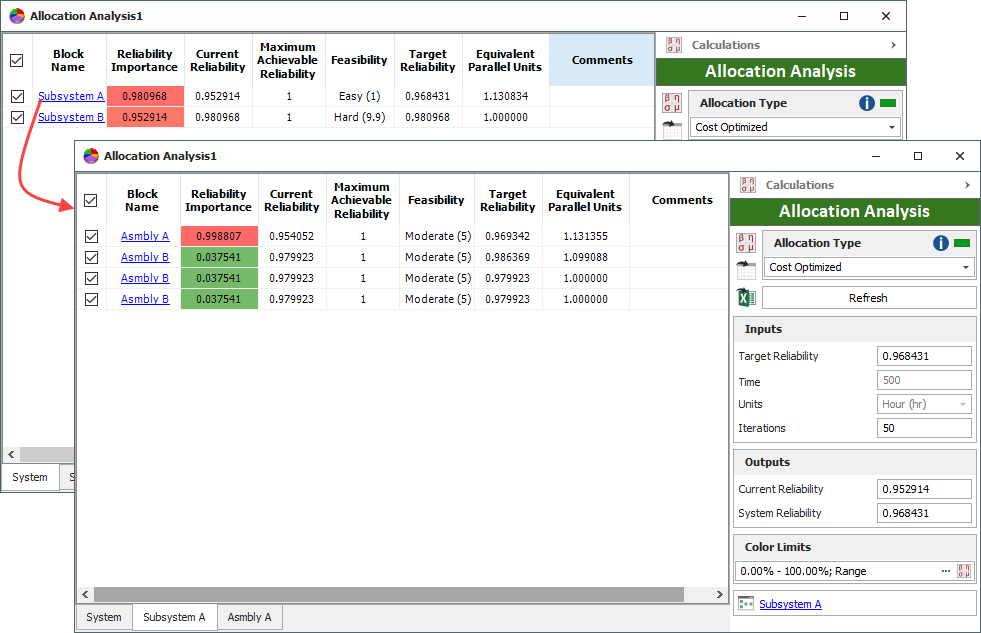
Reliability Allocation
The allocation analysis tool helps determine the reliability requirements for individual components/assemblies that would be needed to achieve an overall reliability goal.
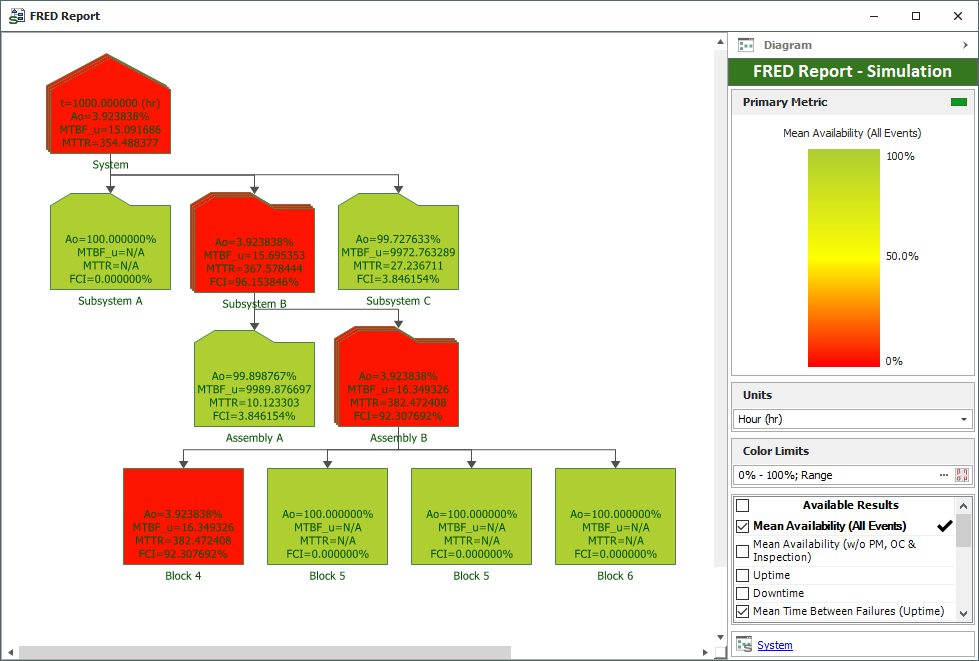
FRED Reports
FRED reports provide a graphical demonstration of the reliability and maintainability/availability characteristics of the components in a system and help to identify the components that may require improvement.
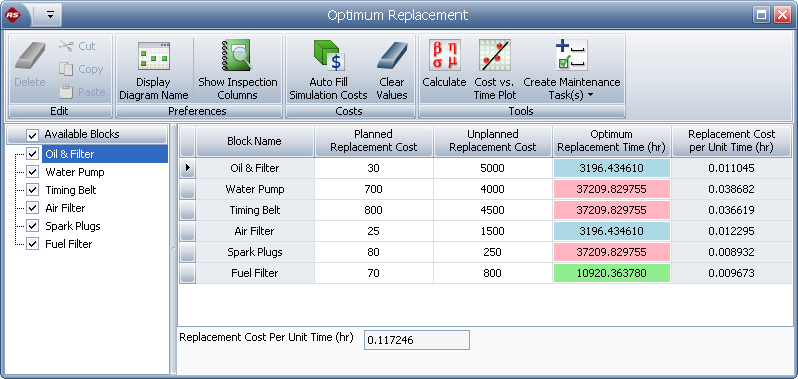
Optimum Replacement
The Optimum Replacement tool helps to determine the best time to inspect and/or replace components, based on the costs for planned and unplanned maintenance.
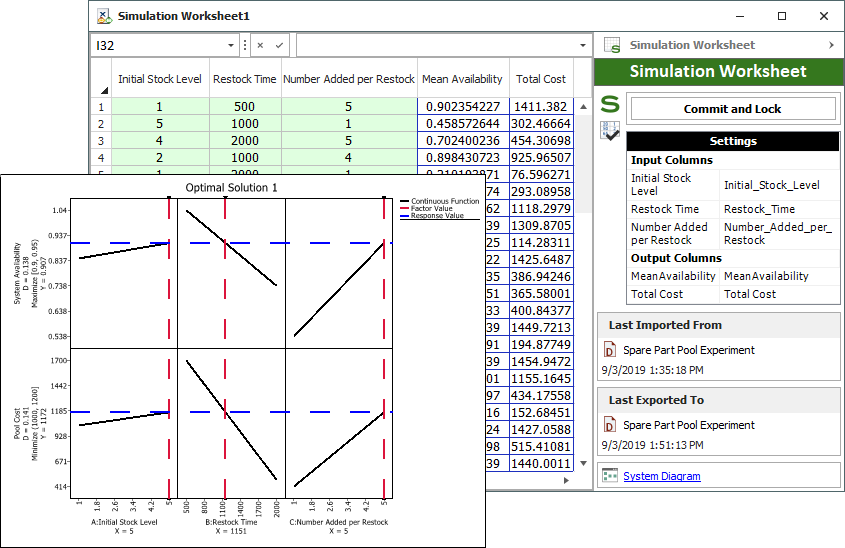
Simulation Worksheets
Simulation worksheets can vary values that are used when simulating an RBD or a flowchart, allowing you to investigate the effect of various factors on the simulation results (e.g., how the restocking interval and initial quantity in a spare part pool affect the cost of maintaining a system). The values can be entered manually, or can be transferred from an experiment design folio in Weibull++. After simulation, you can transfer the results into the design folio in Weibull++ for analysis and/or optimization.
Quick Tour
- Tour Intro
- Databases & Projects
- Fault Trees
- Simulation RBDs
- Event Analysis Flowcharts
- More Analyses & Tools