Allocation Analysis
The allocation analysis tool can help you determine the reliability requirements for individual components/assemblies that would be needed to achieve an overall reliability goal. To use the tool, you do the following:
- Create the allocation analysis.
- Specify a target reliability for the system at a particular time and select which of the individual blocks in the system you would like to consider for improvement.
- Choose the allocation type or method that you want to use.
- Perform the optimization.
You can also create an allocation analysis from within the FMRA view. These allocation analyses offer some features suited to FMRA use.
Create the Allocation Analysis
To add an allocation analysis to the project, choose Home > Insert > Allocation Analysis.
![]()
In the Select Diagram window that appears, select the diagram that you want to perform an allocation analysis for. Allocation analysis can be performed only for analytical diagrams, so all of the diagrams that are available in this window will be analytical diagrams. You can select any diagram that is currently in an analyzed state; diagrams that have not been analyzed will be displayed in the list but cannot be selected. (You can hide these diagrams by selecting the Hide unavailable diagrams check box at the bottom of the window.) When the allocation analysis folio is created, the name of the diagram that it is based on will be displayed at the bottom of the control panel; you can click the diagram name to open it.
In the allocation analysis folio, you will see a table that displays the current reliability and the reliability importance of each of the blocks in the selected diagram. Reliability importance is a measure of the relative importance of each component in a system with respect to the overall reliability of the system. These values are calculated at the mission time specified in the control panel; you can change that value in the control panel and click the Refresh button to update the values in the table accordingly. The current reliability for the entire system is displayed in the Outputs area of the control panel, and is also dependent upon the specified mission time.
Tip: The order of the blocks in the table is controlled by the Set Block Order command in the associated diagram.
The color coding used in the Reliability Importance column provides a quick visual indicator of how important the blocks are to the system reliability. You can adjust the threshold for the colors by clicking the Adjust Color Limits button (...) in the Color Limits field in the control panel. Move the sliders to indicate the values below which you want everything to be displayed in green (i.e., least important) and above which you want everything to be displayed in red (i.e., most important). To automatically determine a min/max for the Color Limits based on the values in the Reliability Importance column of the current tab, click the Calculate Color Limits button.
Specify Included Blocks and Settings
Select the check box in the first column for each block that you want to consider for improvement in the allocation analysis. Any block that has a model assigned to it can be considered in the optimization process; standby and load sharing configurations are considered at the container/gate level, not at the contained block/dependent event level. You can select or clear the check box in the column heading to select or clear all of the individual check boxes. The goal of an allocation analysis is to improve the reliability of the system; this purpose is best served if you do not select blocks with very low reliability importance or with very high current reliability values. If any blocks included in the allocation analysis were simplified using identical block simplification (IBS), the allocation cannot be performed; you will need to turn off IBS and reanalyze the diagram.
In the Inputs area of the control panel, enter the following information:
- The Target Reliability is the system reliability that you want to reach.
- Time is the mission time, or the time at which the optimization will be conducted. You must specify the units for this measurement. For example, if you want to determine the optimum scenario for increasing component reliability in order to achieve a system reliability of 0.98 at 100 days, you would enter 100 in the Time field and choose Day in the Units field.
- Iterations allows you to specify the maximum number of iterations of the optimization algorithm to be conducted in order to obtain a solution.
Choose the Allocation Type
The software provides three allocation types that can be used to logically apportion the system reliability across the selected blocks. Select the desired allocation type in the Allocation Type field in the control panel. Available allocation types include:
- The equal allocation type achieves the specified target reliability for the system by determining a single target reliability value that all selected blocks must reach, regardless of their current reliability or reliability importance. If you select this allocation type, you do not need to enter any additional information for each block.
- The weighted allocation type allows you to specify a weight for each selected block, which is used in determining the block's target reliability. If you select this allocation type, you will need to enter a weight for each selected block. If all selected blocks are given the same weight, they will all have the same target reliability. Weighted allocation is typically used only if all components have constant failure rates (i.e., exponential distributions), commonly in electronics.
- The cost optimized
allocation type allows you to meet the system's target reliability
at the lowest possible cost. This allocation type determines
the target reliability for each selected block based on the
maximum reliability that can be achieved for the block and
the relative difficulty or cost of increasing the block's
reliability. If you select this allocation type, you will
need to enter two additional values for each selected block:
- In the Maximum Achievable Reliability column, enter the greatest reliability that the component can possibly reach at the mission time specified in the control panel. This value is a limiting reliability that the component will approach, but not reach. It should be based on engineering judgment and experience, taking into account the current state of the art of the component and other similar factors.
-
In the Feasibility column, specify the difficulty
of increasing the component's reliability, relative to
that of increasing the reliability of the rest of the
components in the system. Depending on the design complexity,
technological limitations, etc., certain components can
be very hard to improve. Clearly, the more difficult it
is to improve the reliability of the component, the greater
the cost. In the drop-down for each cell in this column,
there are two ways to specify this value. You can select
to use a predefined feasibility value, in which case you
simply move the marker on the scale to the desired location
between Easy (0.1) and Hard (9.9). You can also select
to enter your own feasibility equation. If you choose
to do this, the equation, or function, must meet the following
requirements:
- The function must include a reference to the reliability of the component, which is denoted by an R.
- The function must return a positive value.
- The function must be described in notation similar to that used in Excel.
Since the evaluation is relative, any feasibility functions that you enter should be correlated with one another. In addition, you should not use your own functions for some components and the predefined feasibility values for others unless you are sure that your functions are correlated to the function used to calculate the predefined values. For this reason, it is preferable to use the predefined values unless you have a compelling reason to do otherwise.
The default feasibility function used in BlockSim is defined by:
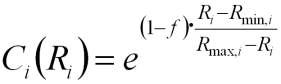
where:
- Ci(Ri) is the penalty (or cost) function as a function of component reliability.
- f is the feasibility (or cost index) of improving a component's reliability relative to the other components in the system.
- Rmin,i is the current reliability at the time at which the optimization is to be performed.
- Rmax,i is the maximum achievable reliability at the time at which the optimization is to be performed.
Perform the Analysis
Click the Optimize icon.
![]()
Once optimization has been performed, the following information will be displayed for each selected block:
- The target reliability, which is the reliability of the component at the specified mission end time that would be required in the optimum scenario to increase component reliability to reach the specified reliability goal.
- Equivalent parallel units, which indicates the number of identical blocks that would be required in a parallel configuration for the particular block to meet the specified reliability goal, in lieu of increasing the component's reliability.
In addition, the System Reliability field in the Outputs area of the control panel will display the reliability of the system if the optimum scenario is implemented (i.e., if all selected blocks are improved to their target reliability values).
Note: Subdiagram blocks are displayed as hyperlinks. You can click the name of the subdiagram block to add another tab to the allocation analysis folio, where you can perform allocation analysis for the subdiagram.
You can click the Transfer to Spreadsheet icon to save the results in a ReliaSoft Workbook.
![]()
The Select Workbook window that appears allows you to select an existing workbook or add a new one to the project. If you select an existing workbook, you can select the Overwrite Existing Sheets check box to overwrite the current contents of the workbook. If you do not select this check box, a new sheet will be added to the workbook. If you select to add a new workbook, you will be prompted for the workbook name.
You can click the Send to Excel icon to save the results as an Excel file.
![]()
In either a ReliaSoft Workbook or an Excel file, the results will look like the ones shown next.
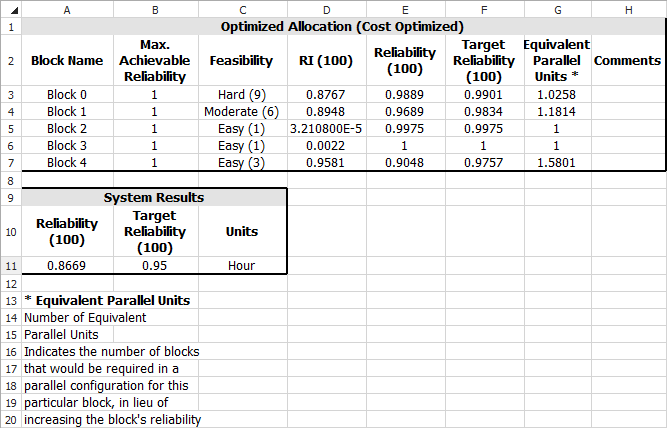
The first row displays the name of the optimized diagram and the allocation type that was used in the optimization. For each selected block, the following information is shown:
- The block name.
- Any inputs that you entered:
- For the Equal allocation type, no block-level inputs are shown.
- For the Weighted allocation type, the Weight for each block is displayed.
- For the Cost Optimized allocation type, the Maximum Achievable Reliability and the Feasibility for each block are displayed.
- RI (Time) is the block's reliability importance at the specified mission time.
- Reliability (Time) is the block's reliability at the specified mission time if no improvements are made.
- Target Reliability (Time) is the block's goal reliability at the specified mission time in order to meet the target system reliability.
- Equivalent Parallel Units is the number of identical blocks that would be required in a parallel configuration for the particular block to meet the specified reliability goal, in lieu of increasing the component's reliability.
The System Results include the following:
- Reliability (Time) is the system's reliability at the specified mission time if no improvements are made.
- Target Reliability (Time) is the system's reliability at the specified mission time if the optimum scenario is implemented. This is the Target Reliability that you specified on the control panel.
- Units displays the units that were specified for the mission time.
FMRA Allocation Analysis
Following the steps above, you can create an allocation analysis based on any analytical FMRA diagram that inherits its reliability from its dependents. You can also create allocation analyses for such diagrams directly within the FMRA view by choosing FMRA > Calculations > Allocation Analysis.
![]()
Allocation analyses created in this way offer some different features that are suited to FMRA use.
- All analyses for subdiagrams are created when the allocation analysis is created. Simply click the tabs at the bottom of the folio to access them.
- Two views are available. The Tabs view corresponds to the standard view in all allocation analyses. The Hierarchy view shows the entire allocation, including any subdiagrams, listed in the order of the items' hierarchical level. If you use this view to calculate, all tabs in the Tabs view are calculated.
- When working in the Tabs view, you can choose Allocation > Transfer > Transfer Target Reliability to FMRA to transfer the calculated target reliability values for each block to the associated FMRA item in XFMEA/RCM++.
![]()
An allocation analysis created from within the FMRA view will not appear in the current project explorer. However, you can reopen it by choosing the command again.