Optimum Replacement Window
The Optimum Replacement window helps you to determine the best time to inspect and/or replace components, based on the costs for planned (i.e., preventive) and unplanned (i.e., corrective) maintenance. If you are calculating the optimum inspection time, it also considers the failure detection threshold.
Preventive maintenance is a logical choice if, and only if, the following two conditions are met:
- Condition #1: The failure rate of the component in question increases with time, implying wearout.
- Condition #2: The overall cost of the preventive maintenance action must be less than the overall cost of a corrective action (including downtime costs, loss of production, lawsuits over the failure of a safety-critical item, loss of goodwill, etc.).
The ReliaWiki resource portal provides more information on preventive maintenance and the Optimum Replacement window at: http://www.reliawiki.org/index.php/Introduction_to_Repairable_Systems.
Analyze a Block or Diagram
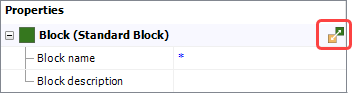
To access the Optimum Replacement window for a single block, click the Optimum Replacement icon in the Block Properties window.
To consider multiple blocks in the same diagram, open the diagram and choose [Diagram/Fault Tree] > Calculation > Optimum Replacement. For an FMRA diagram, choose FMRA > Calculations > Optimum Replacement.
![]()
Available Blocks
You can perform individual block calculations for standard blocks (including contained blocks) in RBDs and for events (including dependent events) in fault trees. You can also perform an individual calculation for a standby container; in this case, the switch is the item that is optimized, not the container itself.
If you are working with a diagram or FMRA, use the Available Blocks area on the left side of the window to select which of the eligible components to analyze.
Tip: The order of the blocks in the list does not affect the calculations. If you want to change the order for convenience or cosmetic reasons, it is controlled by the Set Block Order command in the associated diagram.
To be available for inclusion in the optimization calculations:
- Blocks must have a failure model.
- Switches must have a failure model assigned.
- The failure model for a switch or a block must meet
the following requirements.
- Fixed reliability and exponential distributions are not allowed.
- Weibull distributions must have beta > 1.
- Gamma distributions must have k > 1.
- Loglogistic distributions must have std < 1.
- For generalized gamma distributions and mixed Weibull distributions, there must be an increasing failure rate within at least one time period. A local optimum can then be found within intervals with an increasing failure rate.
Planned and Unplanned Replacement Costs
In the table, the columns with white backgrounds require input. The Planned Replacement Cost and Unplanned Replacement Cost are always required.
For blocks in an analytical diagram, you can type the cost directly into each cell.
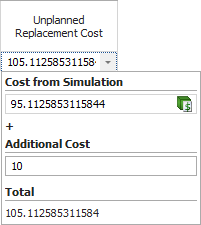
For blocks in a simulation diagram, you have the option to estimate the cost based on the simulation results, if desired. Make sure the diagram is simulated and then click Auto Fill Simulation Costs.
![]()
If you want to add additional costs that were not estimated from the simulation, click the arrow in the cell to show both inputs.
Inspection Cost and Failure Detection
If you want to calculate optimum inspection times, make sure the Show Inspection Columns command is toggled on.
![]()
Inspection Cost is the cost for the inspection task(s) or the inspection portion of the on condition task(s).
Failure Detection is the failure detection threshold (FDT), which is the percentage of the item's life that must have elapsed in order for approaching failure to be detected.
Calculation Options
If you are working with a diagram instead of with a single block, when you click Calculate, you can choose from the following options:
- Individual - Calculate the individual optimum replacement time for each item. If you are calculating optimum inspection times, you must use this option.
- Common - Calculate a common optimum replacement time, which is the most cost-effective time to replace all of the selected items concurrently.
- Clusters - Calculate clustered optimum replacement times, which allows you to specify a number of groups in which to replace the selected items. For example, if you enter 3 in the Number of clusters field, the software will determine the three best times to replace groups of items such that all of the selected items are replaced at one of the three times, at overall minimum cost.
Results and Plots
The table shows the results for each block. The total costs per unit time based on all included blocks are displayed under the table. All results are given in the default units for the database, as specified in the Unit Settings window.
Click Cost vs. Time Plot to show a plot of the results.
![]()
Create Tasks
For simulation diagrams, you can click Create Maintenance Task(s) > At [Replacement/Inspection] Time to create preventive and/or inspection tasks for one or more of the items.
![]()
The window that appears allows you to select which items to create tasks for. Preventive tasks created in this way restore the item to as good as new condition and are scheduled at fixed intervals based on item age, equal to the optimum replacement time.