Result Storage Blocks
A result storage block stores numerical values passed to it during event analysis flowchart simulations, and then computes or holds a result based on one of the following options:
- Average of Results computes the average value of the numbers that were passed to the result storage block. Each time a new value is passed to the block, the average is recomputed. If the block is called during simulation, it will return the latest average of the values.
- Sum of Results computes the sum of the numbers that were passed to the result storage block. The total sum is recalculated with each new value that is passed to the block. If the block is called during simulation, it will return the latest sum of the values.
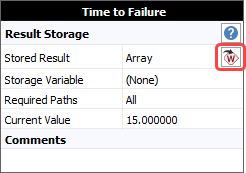
- Array of Results allows the result storage block to hold an array of values. These values may be used to perform various statistical calculations, such as calculating the variance, standard deviation, etc. If the block is called during simulation, it will return only the most recent value that was added to the array. The values stored in the block are displayed in the Results Explorer. If you have selected a result storage block of type array in a simulated flowchart, you can click the Transfer Data to Weibull++ icon in the Information area of the control panel to create a Weibull++ life data folio containing the stored values.
- Minimum of Results holds the smallest numerical value that was passed to the result storage block. Each new value that is passed to the block is compared to the value that is currently stored. If the new value is less than the stored value, the block discards the stored value and replaces it with the new value; otherwise, the new value is discarded.
- Maximum of Results holds the largest numerical value that was passed to the result storage block. Each new value that is passed to the block is compared to the value that is currently stored. If the new value is greater than the stored value, the block discards the stored value and replaces it with the new value; otherwise, the new value is discarded.
- Last Value holds only the latest value that was passed to the result storage block. Each new value that is passed to the block replaces the old value.
- Normalized Sum of Results adds the values that were passed to the result storage block and divides by the number of simulations. If the block is called during simulation, it will return the summed value currently stored divided by the total number of simulations to be performed.
For example, if you select the Average of Results option, and then run 100 simulations on the following configuration (a single simulation is a single pass through the flowchart), then the block that generates a random number will pass a total of 100 random values to the result storage block, which will compute the average value of the numbers as they come in.

The following picture shows the Block Properties window of the result storage block in the example. The Store field allows you to select the output of the block. In this case, it stores the average of results.
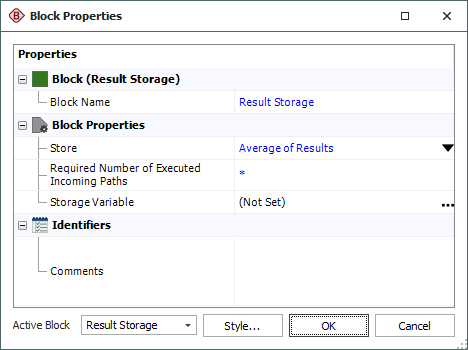
A result storage block can have any number of incoming paths and any number of outgoing paths (i.e., the same output value is passed to more than one block). In addition to storing the results, the block may be configured to store the output in a variable. The Storage Variable field in the Block Properties window of the block displays the name of the variable, if any. If the result storage block is holding an array of results, only the most recent value that was added to the array will be stored in the variable.
Advanced Configurations
-
If your block has multiple incoming paths, you can configure the block to not pass an output or compute a result until the block has received a certain number of inputs. This allows you to control the number of inputs that the block processes at any given time. To do this, enter a value in the Required Number of Executed Incoming Paths field in the Block Properties window. Note that this value simply refers to how many inputs are required, and does not distinguish based on which path(s) the inputs come from. For example, if there are three incoming paths and three required inputs, one input from each path would trigger the block, but so would three inputs from the first path. An asterisk (*) in this field means that the required number of inputs is equal to the number of paths into the block. See Flowchart Configurations and Execution for an example.
Conditional Formatting
Conditional formatting allows you to mark the result storage block with a corner indicator in a particular color when it meets a certain condition. For instance, you might wish to mark the block with red if the computed result is less than a particular value. The conditional formatting corner indicator appears at the upper left corner of the block. To apply conditional formatting, select the result storage block(s) and choose Format > Styles > Conditional Formatting or right-click the result storage block(s) and select Conditional Formatting on the shortcut menu.
There are two types of conditional formatting that you can apply in the Conditional Formatting window:
- You can click the Set of Conditions button to define conditions and specify the color of the block under each condition. To enable each condition, select the Use this condition check box. The fields directly below will be enabled, allowing you to select the conditional operator, enter the value(s) against which the value of the result storage block will be checked and specify a color to be used when the value meets the condition. Available conditional operators are:
= (equal to)
<> (not equal to)
<= (less than or equal to)
< (less than)
>= (greater than or equal to)
> greater than
Between
Not between
You can define up to six conditions, and can enable and disable them with the Use this condition check boxes. The conditions you have defined will be saved even when disabled. Enabled conditions do not need to be immediately consecutive. Keep in mind, however, that the conditions are evaluated in the order in which they are displayed in this window and that if a result storage block meets more than one condition, the first true condition will be applied.

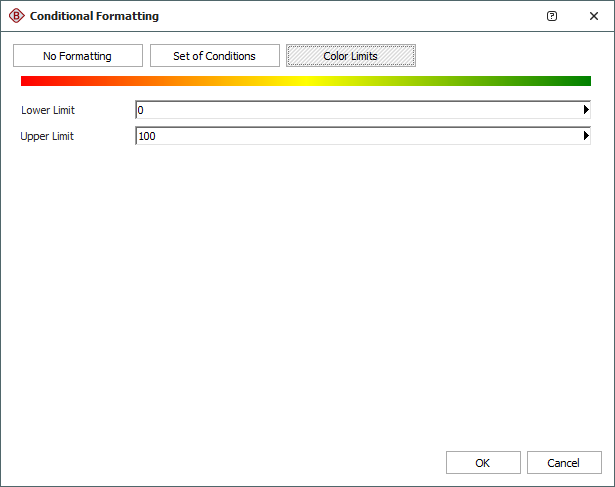
- You can click the Color Limits button to define a range of values across which the range of colors from red to green will be applied. Result storage blocks with values close to the specified lower limit will be marked with red corner indicators; those with values close to the specified upper limit will be marked with green corner indicators.
In both types, for the value(s) against which the result storage block is checked, the expression can include:
-
Numerical values
-
Predefined mathematical functions (exp, log, sin, etc.)
-
References to any ReliaSoft Workbooks
You can enter the equation manually, or you can use the function selector or the equation editor to assist you. Resources, ReliaSoft Workbooks and internal functions are automatically color-coded while you are editing the equation, to improve readability.
When the cursor is positioned on a resource, ReliaSoft Workbook or predefined or internal function, a preview area appears and displays a summary of the item. Starting in Version 2019, if a function requires parameters, the preview area indicates (in all capital letters) which parameter you are currently entering; additionally, for nested functions, the preview area displays the current function and the parent function. If the item is a resource, you can click the View icon in the preview area to open that resource's properties window.
![]()
You can enclose a resource name in single quotes to reference it by name. When the item using the expression is transferred to another project or database, any resource referenced by name will not be transferred along with it. If the destination project contains a resource with the same name as the one referenced by name, that resource will be used during simulation of the transferred item. For example, if you export a diagram that contains a block using the expression 'Model1'(1000) from Project1 to Project2, Model1 will not be transferred along with that diagram. If Project2 already contains a model called Model1, that model will be used in simulating the transferred diagram. You can also reference ReliaSoft Workbooks by name.
IMPORTANT: All values and results are assumed to be in terms of the default unit specified for the database. See Using Time Units in Event Analysis Flowcharts for details on how this may affect your analysis.
You can click the No Formatting button to turn off conditional formatting for the selected block(s).
Note that for result storage blocks of type array, the conditional formatting will be based on the most recent value. The size of the conditional formatting corner indicators can be changed via the Block Corner Indicators pages of the Diagram Style window.