Degradation Analysis Folio
Degradation analysis is a technique that uses the performance (degradation) measurements of a product over time to predict the point at which each unit in the sample is expected to fail. This analysis is useful for tests performed on products with very high reliability, where it is not possible to test the units to failure under normal conditions.
Weibull++ offers two types of degradation analysis folios:
- Nondestructive degradation analysis folios are for cases where it is possible to directly measure the degradation of a physical or performance characteristic over time (e.g., depth of tire tread, voltage of battery, propagation of crack size, etc.). In this case, you take multiple measurements per test unit over time. The folio extrapolates the times at which the amount or level of degradation is serious enough that the unit is considered to be failed, and then automatically performs life data analysis on the extrapolated failure times.
- Destructive degradation analysis folios are for cases where it might not be possible to measure the degradation without invasive or destructive techniques that would directly affect the subsequent performance of a product (e.g., corrosion in a chemical container, strength measurement of adhesive bond, etc.). Only one measurement is taken per test unit and multiple samples are required at different points in time. Unlike the nondestructive degradation folio, which extrapolates the failures times, the destructive degradation analysis folio fits the measurements directly to the chosen degradation model and life distribution, and then uses the result to predict future failure behavior.
The ReliaWiki resources portal has more information on degradation analysis at: http://www.reliawiki.com/index.php/Degradation_Data_Analysis.
Degradation Analysis Folio Setup
To add a degradation analysis folio, choose Home > Insert > Degradation, or right-click the Degradation folder in the current project explorer and choose Add Degradation on the shortcut menu.
![]()
In the setup window, select the type of degradation analysis folio to create. If you have Accelerated Life Testing activated on your computer, all four options will be available. The Accelerated Life Testing degradation analysis folios are similar to life data except that accelerated stress levels are used during testing to further reduce the test time required to obtain the predicted failure times.
Weibull++
![]() Nondestructive Degradation
Nondestructive Degradation
![]() Destructive Degradation
Destructive Degradation
Accelerated Life Testing
![]() Accelerated Nondestructive Degradation
Accelerated Nondestructive Degradation
![]() Accelerated Destructive Degradation
Accelerated Destructive Degradation
Degradation Folio Data Sheet
There are two options for displaying data in degradation analysis folio data sheets:
- The Unit View is available for all analysis folio data sheets. This corresponds to the view that is used in earlier versions of the software.
- The Inspection View is available only for nondestructive folio data sheets.
For nondestructive degradation analysis folios, there are two options for the data sheet view: the Unit View and the Inspection View. When you create the folio, you will be able to choose which view to use.
For destructive degradation analysis folios, only the Unit View is available.
Unit View
When using this view, you enter measurements on a separate row for each unit and inspection time:
- Inspection Time - the time at which the degradation was measured. Time may also be measured as the amount of usage the unit accumulates or as the factor that degrades the unit. In nondestructive degradation analyses, the level of degradation may be measured either continuously or at predetermined intervals of time.
- Degradation - the degradation measurement.
- Unit ID - the test unit being measured.
- Stress - for Accelerated Life Testing degradation analysis folios, the stress type and stress level.
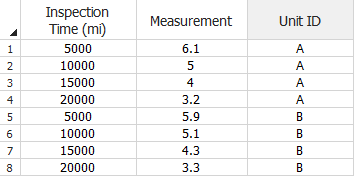
The following example shows a Weibull++ nondestructive degradation analysis for two automobile tires, A and B. The inspection time is in mileage because of its direct relation to the wear on the tires.
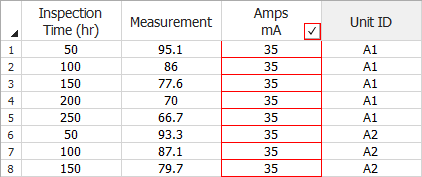
The following example shows an accelerated nondestructive degradation analysis for two LED units, A1 and A2. The light intensity is inspected every 50 hours and measured in milliamperes.
Inspection View
When using this view, you enter measurements for multiple units at each inspection time.
- Inspection Time - the time at which the degradation was measured. Time may also be measured as the amount of usage the unit accumulates or as the factor that degrades the unit.
- Unit ID(s) - the specific test unit being measured, with separate columns for each test unit. (You can rename a column by right-clicking the column heading and choosing Rename Column on the shortcut menu.)
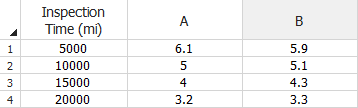
The following example shows a Weibull++ nondestructive degradation analysis for two automobile tires.
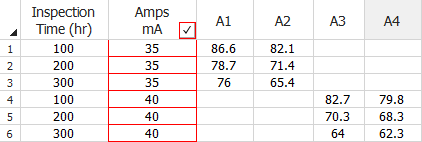
The following example shows a nondestructive degradation analysis for four LED units.
You can add additional unit IDs to the data sheet by clicking the Add/Remove Columns icon on the Main page of the control panel.
![]()
To switch between the views, choose Degradation > Format and View > [Switch to Unit View/Switch to Inspection View].
![]()
Conditions
If you are switching from the Inspection View to the Unit View:
- For nondestructive degradation folios with life data
analysis:
- Any unit ID column that does not have a measurement value associated with it will become its own line in the Unit View.
- Any inspection time that does not have a measurement value associated with it will become its own line in the Unit View.
- For nondestructive degradation folios with Accelerated
Life Testing:
- Any unit ID column that does not have a measurement value associated with it will become its own line in the Unit View.
- Any unique combination of inspection time and stress column that does not have a measurement value associated with it will become its own line in the Unit View.
Control Panel Settings
The degradation folio control panel contains most of the tools you need to perform a degradation analysis. For more information about control panels in general, see Control Panels.
- Degradation Model allows you select the mathematical model that best describes the product's degradation over time. The available degradation models are: linear, exponential, power, logarithmic, Gompertz and Lloyd-Lipow. In Weibull++ nondestructive degradation analyses,you can also choose User-Defined. See User-Defined Degradation Models.
Tip: If you are not certain which degradation model would provide the best fit for your data, you can use the Degradation Model Wizard to guide you through the selection process.
- Critical Degradation is the level of degradation that is considered a failure. For example, you might wish to define failure as the time when the depth of the tire tread is less than 2 millimeters.
- Suspend After is available for nondestructive degradation analyses only. It allows you to define a censoring time past which no failure times are extrapolated. In practice, there is usually a rather narrow band in which the censoring time has any practical meaning. If the censoring time is relatively low, no failure times will be extrapolated, which defeats the purpose of the degradation analysis. On the other hand, a relatively high censoring time would occur after all of the theoretical failure times, thus rendering the censored data meaningless. Nevertheless, certain situations may arise in which it is beneficial to censor the degradation data. For example, if your product has a maximum warranty life of 10,000 hours, then you may want to treat all failures beyond that time as suspensions.
Nondestructive Degradation
- Life Data Model/ALTA Model contains the settings for performing life data/life-stress data analysis on the extrapolated failure times. These settings have no effect on the degradation analysis calculations; they affect only the life data/life-stress data analysis calculations.The settings in this area are identical to the settings on the control panel of a life data folio or life-stress data folio except for the Use extrapolated intervals check box, which allows you to extrapolate the failure/suspension times as interval censored data. Selecting this option calculates the intervals as bounds around the extrapolated data points.
Note: If the distribution and parameters are associated with a published model, then the model's name will appear as a link at the bottom of the Life Data Results area. Click the link to view the model's properties. See Publishing Models.
- Degradation Results displays the parameters of the chosen degradation model and the extrapolated failure/suspension times. Click the button to view the results in a worksheet.
- Life Data/ALTA Results displays the parameters of the life data/life-stress data model. Click the button to view the results in a worksheet.
Destructive Degradation
- Measurement Distribution allows you to select a distribution that represents the variability of a degradation measurement at a given time. The maximum likelihood estimation (MLE) method is used to estimate the distribution's parameters, and the Fisher matrix (FM) method is used to solve for the confidence bounds.
- Analysis Summary displays the calculated parameters and other values for the selected distribution. Click anywhere within the area to view the results in a worksheet.
Folio Tools
The folio tools are arranged on the left side of the Main page of the control panel. Use these tools to manage data and experiment with the results of your analysis.
![]() Calculate
analyzes the data set. This command is also available by choosing
Degradation > Analysis >
Calculate.
Calculate
analyzes the data set. This command is also available by choosing
Degradation > Analysis >
Calculate.
![]() Plot creates
a new sheet in the folio that provides a choice of applicable
plot types. This tool is also available by choosing Degradation > Analysis > Plot.
Plot creates
a new sheet in the folio that provides a choice of applicable
plot types. This tool is also available by choosing Degradation > Analysis > Plot.
![]() QCP opens
the Quick Calculation Pad,
which allows you to calculate life data/life-stress data analysis
metrics, identical to the calculations you can perform in a life
data/life-stress data folio. This tool is also available by choosing
Degradation > Analysis >
Quick Calculation Pad.
QCP opens
the Quick Calculation Pad,
which allows you to calculate life data/life-stress data analysis
metrics, identical to the calculations you can perform in a life
data/life-stress data folio. This tool is also available by choosing
Degradation > Analysis >
Quick Calculation Pad.
![]() Degradation Model
Wizard opens the Degradation
Model Wizard, which helps you select the degradation model
that best fits your data. This tool is also available by choosing
Degradation > Analysis >
Model Wizard.
Degradation Model
Wizard opens the Degradation
Model Wizard, which helps you select the degradation model
that best fits your data. This tool is also available by choosing
Degradation > Analysis >
Model Wizard.
![]() Distribution Wizard
opens the Distribution
Wizard, which helps you select the distribution that best
fits the data set. This tool is also available by choosing Degradation > Analysis > Distribution
Wizard.
Distribution Wizard
opens the Distribution
Wizard, which helps you select the distribution that best
fits the data set. This tool is also available by choosing Degradation > Analysis > Distribution
Wizard.
![]() Add/Remove Columns
Add/Remove Columns
- For life data nondestructive folio data sheets, this allows you to add or remove subset ID columns when using the Inspection View.
- For Accelerated Life Testing nondestructive data sheets, this allows you to add or remove columns for stress levels and, when using the Inspection View, add or remove subset ID columns.
This tool is also available by choosing Degradation > Format and View > Add/Remove Columns.
![]() Change Units
opens the Change Units window,
which allows you to change the units for the values in the current
data sheet. This tool is also available by choosing Degradation > Format and View > Change Units.
Change Units
opens the Change Units window,
which allows you to change the units for the values in the current
data sheet. This tool is also available by choosing Degradation > Format and View > Change Units.