Distribution Wizard
The Distribution Wizard for life data analysis folios performs multiple goodness of fit tests to determine the best distribution for a data set based on the chosen parameter estimation method. Note that the Distribution Wizard only serves as a guide. You should compare its suggestion with your own engineering knowledge about the product being modeled before making the final decision on which distribution to use for your data set.
(For information on the Distribution Wizard for Accelerated Life Testing life-stress data folios, see Accelerated Life Testing Distribution Wizard.)
Comparing Distributions
To use the Distribution Wizard, you must have at least two failure data points in the current data sheet.
The first step is to choose a parameter estimation method from the control panel. Then open the Distribution Wizard by choosing Life Data > Analysis > Distribution Wizard or by clicking the icon on the Main page of the control panel.
![]()
On the Main tab of the Distribution Wizard, select the distributions you would like to consider. (The available distributions will vary depending on which folio you opened the tool from.) Then click Analyze to start the evaluation.
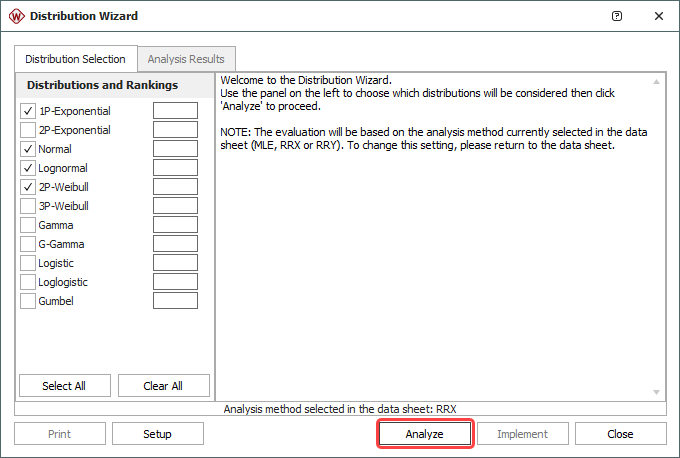
The distributions will be ranked according to how well they fit the data, with rank 1 being the best fit. Several metrics corresponding to the distributions will be displayed alongside their ranking.
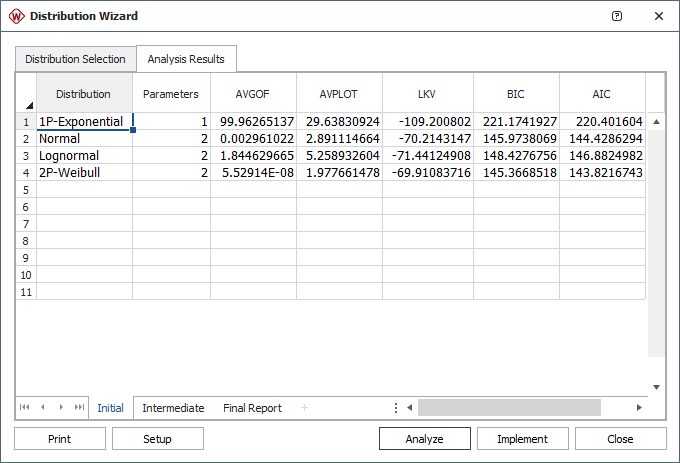
In the example shown next, the 2P-Weibull distribution is the suggested distribution for the data set. The log-likelihood (LKV), BIC and AIC values are displayed for all analyzed distributions; these are goodness of fit tests that can help you compare how well the distributions fit the data.

To calculate the parameters of the distribution in the rank 1 position, click Implement. This closes the Distribution Wizard, and the results will appear in the Analysis Summary area of the control panel. To return to the initial selection window, select the Distribution Selection tab at the top of the window.
Note: You may find that the Distribution Wizard recommends strange or unexpected distributions, especially for data sets with a small number of failures. In these situations, you will often find that the difference in quality of fit between the best performing distribution and other, more familiar and interpretable ones is quite small. In this case, you should default to familiar, interpretable or physically justifiable distributions that perform almost as well, instead of always choosing the top ranked distribution.
Goodness of Fit Tests
To see the calculations behind the ranking, click the Initial sheet at the bottom of the Analysis Details tab. The Distribution Wizard performs five goodness of fit tests to determine the rank of the distributions:
- The Kolmogorov-Smirnov test (GOF) is based on the largest difference between plotted and predicted probabilities of failure.
- The Correlation coefficient test (PLOT) is based on the difference between each plotted and predicted probabilities of failure.
- The Likelihood value test (LKV) computes the value of the log-likelihood function, given the parameters of the distribution.
- The Bayesian Information Criterion (BIC) is based on the log-likelihood value, with an additional adjustment factor for number of parameters. It generally penalizes complex distributions more than AIC and performs better for small sample sizes.
- The Akaike Information Criterion (AIC) is based on the log-likelihood value, with an additional adjustment factor for number of parameters. It generally penalizes complex distributions less than BIC and does not perform as well for small sample sizes.
The Initial sheet contains the values computed from the five tests. The AVGOF column is an approximation of 100% minus the p-value of the Kolmogorov-Smirnov test statistic. The AVPLOT column is an approximation of the mean absolute error in predicted probability values, and the LKV column contains the log-likelihood values. The BIC and AIC columns contain the BIC and AIC values.
The Intermediate sheet displays the ranking of the distributions based on the values from the Initial sheet. The RAVGOF column contains the ranking of the GOF test. The RAVPLOT column contains the ranking of the PLOT test. The RLKV column contains the ranking of the LKV test. The RBIC column contains the ranking of the BIC test, and the RAIC column contains the ranking of the AIC test.
The values from the Intermediate sheet are first weighted (e.g., BIC * weight) and then summed into one overall DESV value (i.e., weighted decision variable). The distribution with the lowest DESV value is considered to be the best fit for the data. The weights assigned to each metric can be modified via the Distribution Wizard's Setup window, based on the parameter estimation method. For example, you can opt to give BIC a higher weight than the default 50% for rank regression parameter estimation.
The Final Report sheet displays all the distributions in their final ranking order and the calculated parameters for each distribution.
Distribution Wizard Setup Window
When you open the Distribution wizard from the Weibull++ life data folio, you have the option to change the weights that are used to determine the ranking of the distributions.
IMPORTANT: The settings here are tool-specific, not folio-specific. Any changes you make to the settings will be used every time the Distribution Wizard is opened from any life data analysis folio.
Click the Setup button on the Distribution Wizard window to view the settings, as shown next.
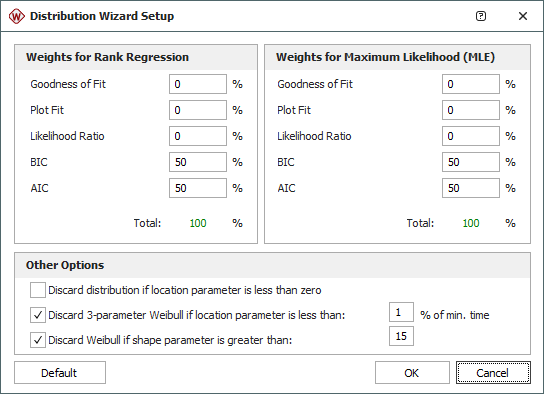
You can use different weights for the rank regression method and the MLE method. The sum of the five weights for each parameter estimation method must equal 100%. The weights are:
- Goodness of Fit represents the weight percentage for the GOF test.
- Plot Fit represents the weight percentage for the PLOT test.
- Likelihood Ratio represents the weight percentage for the LKV test.
- BIC represents the weight percentage for the BIC test.
- AIC represents the weight percentage for the AIC test.
Note: For the free-form data type and for non-parametric life data analysis, only Goodness of Fit and Plot Fit can be considered in the weights for the rank regression method. If the values for BIC and AIC are anything other than zero in these cases, no results can be calculated at all. Likelihood Ratio is not considered in these cases, so it is recommended that it also be set to zero when working with these data types.
The settings in the Other Options area specifically affect the Weibull and exponential distributions:
- Discard if location parameter is less than zero will exclude the Weibull and exponential distributions from the ranking if their location parameters are negative. A negative location parameter indicates that failures occurred before time = 0, or before a product operated for the first time.
- Discard 3-parameter Weibull if location parameter is less than (_)% of min. time will exclude the Weibull distribution from the ranking if the value of the location parameter is smaller than the first time-to-failure. The default setting is for a value that is less than 1% of the first time-to-failure, which is a value close to zero.
- Discard Weibull if shape parameter is greater than (_) will exclude the Weibull distribution from the ranking if the shape (beta) parameter is greater than a specified value. The default setting is to discard the distribution if the beta value is greater than 15.