Degradation Model Wizard
The Degradation Model Wizard performs a goodness of fit test to determine the best degradation model for your data. Note that the degradation model wizard only serves as a guide. You should compare its suggestion with information about the product being modeled before making the final decision.
You can access the wizard by choosing [Degradation/Destructive Degradation] > Analysis > Model Wizard or by clicking its icon on the Main page of the control panel.
![]()
Evaluating and Using Degradation Models
- On the Main tab of the Degradation Model wizard, select the models you would like to consider. The available models will vary depending on which degradation analysis folio you are working with.
- Click Analyze to start the evaluation. The results of the evaluation will be presented as in the example shown next.
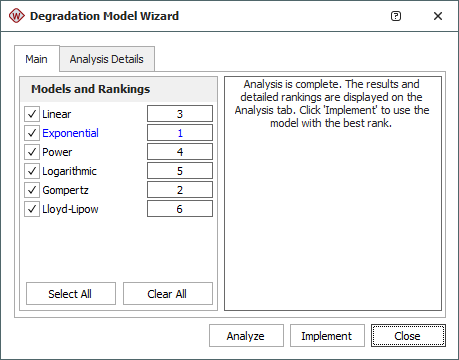
The models will be ranked according to how well they fit the data, with rank 1 being the best fit. In the example shown above, the exponential model is the suggested model for the data set. Click Implement to extrapolate failure times using the suggested model.
Viewing the Analysis Details
The wizard uses the Sum of Square Error (SSE) to evaluate the fit of the data. The calculations behind the ranking can be viewed on the Analysis Details tab, which contains two data sheets:
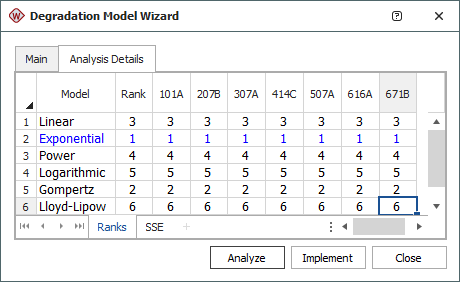
- The Ranks sheet displays the overall ranking as well as the ranking for each model and unit ID based on the SSE evaluation. Due to the randomness of materials, a model that is good for one unit may not be the best for the other units. In the example shown next, the exponential model is the best model for analyzing the data collected for all devices, while the Gompertz model is the second best fit for all devices.
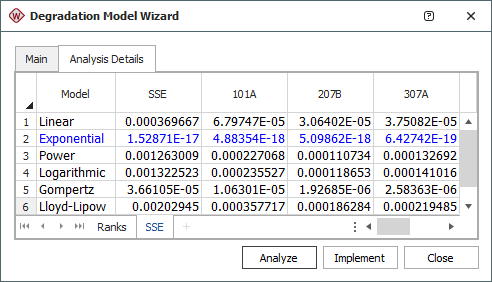
- The SSE sheet shows the sum of square error for each model and unit ID. The values are obtained by first calculating the distance (the error) vertically from each data point to its corresponding value on the fitted model. The error value is squared, and then all the squared values are added up. The SSE column shows the calculated sum of squared errors for each model. The highest rank is given to the model with the lowest SSE value.