 More Analyses and Tools
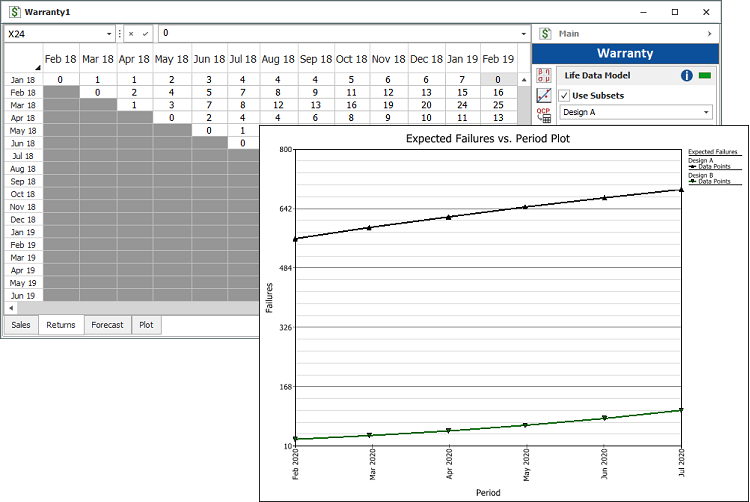
Warranty Data Analysis
For life data analysis, the warranty folio offers a choice of 4 data entry formats that use sales and returns data to predict future returns under warranty: Nevada, Times-to-Failure, Dates of Failure and Usage.
Degradation
For life data and life-stress analyses, the degradation folio extrapolates expected failure times based on how a performance measure (e.g., crack propagation, tread depth, vibration) has degraded over time.

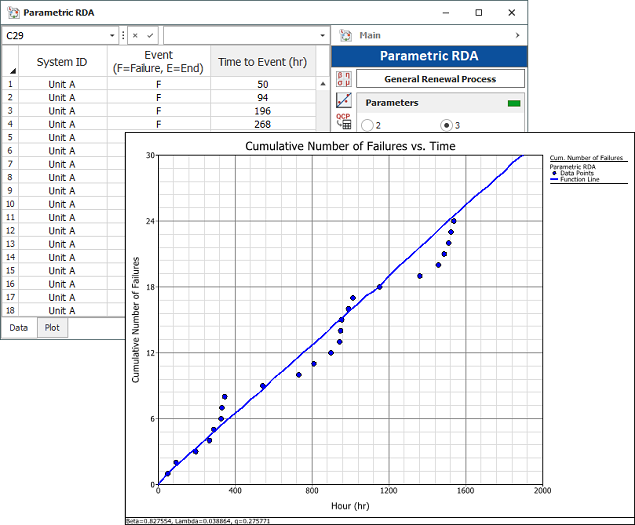
Recurrent Event Data Analysis
For life data analysis, the non-parametric RDA folio uses the Mean Cumulative Function to plot the average number of recurring failures over a given period of time. The parametric RDA folio uses the General Renewal Process (GRP) model, which considers the effectiveness of repairs, to model the cumulative number of failures over time.
Design of Experiments
A set of design folios provide techniques for DOE analyses such as identifying key factors that affect performance (standard design), minimizing a system’s sensitivity to noise (robust design) and determining the best proportion of components in a mixture (mixture design).

Monte Carlo Data Generation and SimuMatic
For life data and life-stress data analyses, the Monte Carlo utility generates a data set based on a specified probability distribution. SimuMatic performs analyses on a large number of simulated data sets, based on a specified probability distribution. For growth data analysis, the Monte Carlo utility generates a data set based on the Crow-AMSAA model, with specified beta and lambda parameters while SimuMatic performs analyses on a large number of simulated data sets, based on the Crow-AMSAA model.
The life data versions look like this:

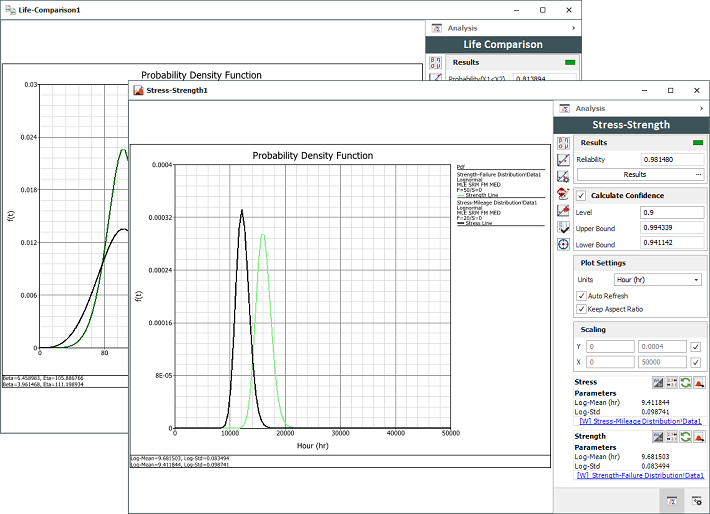
Comparison Folios
The life comparison folio determines the probability that the life of one population will be greater or less than that of the second. The stress-strength analysis folio determines the probability of failure based on the probability of stress exceeding strength.
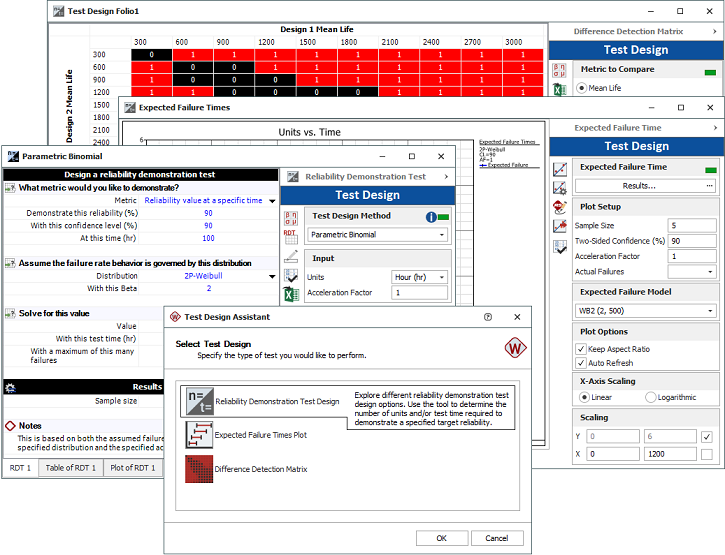
Test Design
For life data analysis, Weibull++ offers a choice of tools to assist with reliability test design: Reliability Demonstration Test (Parametric Binomial, Non-Parametric Binomial, Exponential Chi-Squared or Non-Parametric Bayesian), Expected Failure Times Plot and Difference Detection Matrix. For growth data analysis, the Test Design folio uses the non-homogeneous Poisson process (NHPP) to design a demonstration test for repairable systems by solving for either the test time required per system or the number of systems that must be tested.
Target Reliability Planner
For life data analysis, the Target Reliability folio finds the optimum cost and reliability of a product, given estimates for various factors involved in the product’s production and sale.

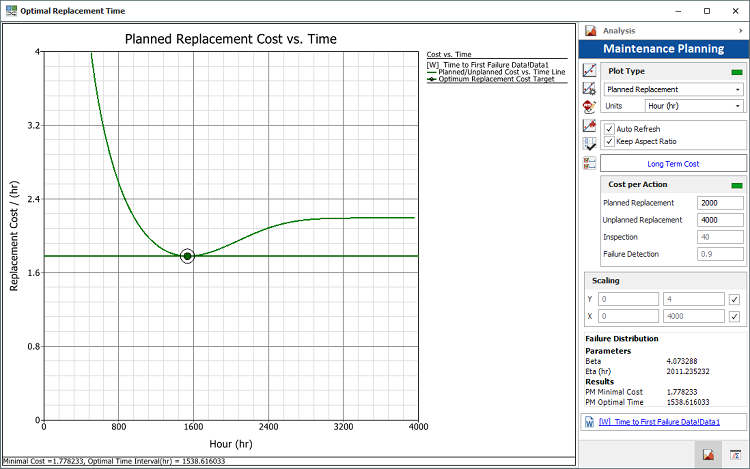
Maintenance Planning
For life data analysis, the Maintenance Planning folio uses the optimum replacement age model to determine the most cost-effective time to replace aged components.
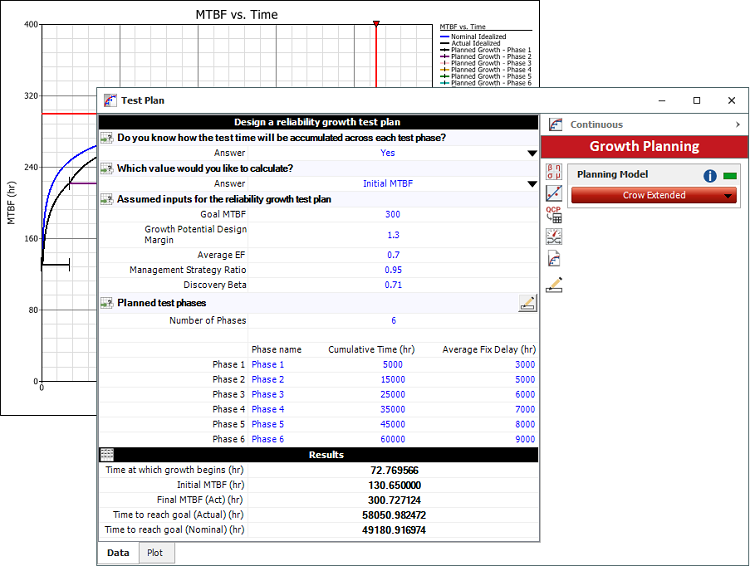
Growth Planning
For growth data analysis, the growth planning folio helps you to create a multi-phase reliability growth testing program that is designed to achieve a specific MTBF or reliability goal.
Multi-Phase Plot
For growth data analysis, the multi-phase plot displays actual test results (e.g., demonstrated, projected and growth potential MTBF or failure intensity) across multiple analysis points and/or test phases. It can be linked to a growth planning folio to compare actual test results against the test plan.

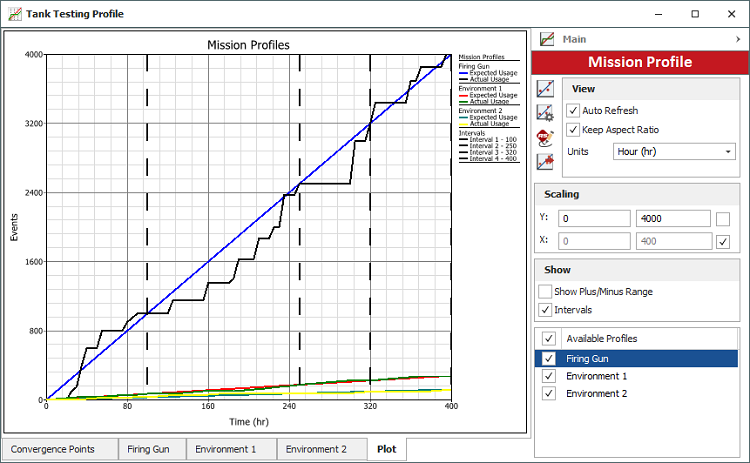
Mission Profiles
For growth data analysis, mission profiles help to create a balanced operational test plan and track the actual testing against the plan to make sure the data will be suitable for reliability growth analysis.
Quick Tour
- Tour Intro
- Databases & Projects
- Life Data Folios
- Life-Stress Data Folios
- Growth Data Folios
- More Analyses & Tools