Tests of Comparison
Weibull++ provides two tools designed for statistical comparison of data sets:
- The Life Comparison tool calculates the probability that the times-to-failure of one population will be greater or less than the times-to-failure of the second. This allows you to compare life distributions from two alternate designs, manufacturers, lots, assembly lines, etc. in order determine whether the units in the first group will outlast the units in the second.
- The Stress-Strength comparison tool allows you to determine the probability of failure based on the probability of stress exceeding strength. The strength data set could be actual data that represents the strength of the material (i.e., minimum applied stress to cause failure) and the stress data set could be the actual stress levels that the material will experience under use conditions.
Both tools are based on the same underlying probability equation, and both folios function in a similar way. Both tools are described in the following sections.
Folio Setup
To add a life comparison or stress-strength folio to a project, right-click the Comparison folder in the current project explorer and choose the folio type.
![]() Life Comparison
Life Comparison
![]() Stress-Strength Comparison
Stress-Strength Comparison
When you add the folio to a project, you will be asked to select two data sheets to compare. Note that the data sheets must have already been analyzed (i.e., the parameters of the distribution have been calculated) in order for you to select them.
After you select the data sheets, the software will automatically plot the distributions of the data sets and estimate the probability value. You can then use the control panel settings in the folio to perform additional analyses or change how you want the probability value to be calculated.
Probability Equation
The life comparison test uses the following equation to evaluate the probability of failure based on the probability that the life of the second data set is greater than or equal to the life of the first data set [Brown, Gerald G. and Rutemiller, Herbert C. "Evaluation of P[X>=Y] When Both X and Y are from Three-Parameter Weibull Distributions." IEEE Transactions in Reliability, R-22, no. 2 (1973).]:
|
|
(1) |
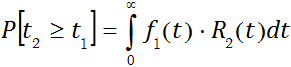
where f(t) is thepdfof data set 1 and
- If P = 0.5, then the lives of both data sets are equal.
- If P > 0.5, then the life of data set 2 exceeds the life of data set 1. For example, if P = 0.8, then data set 2 is better than data set 1 with an 80% probability.
- If P < 0.5, then the life of data set 1 exceeds the life of data set 2. For example, if P = 0.10, then data set 1 is better than data set 2 with a 90% probability (1 - 0.10 = 0.9).
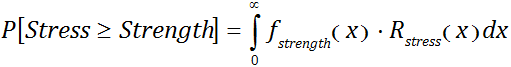
For the stress-strength test, Eqn. (1) may be expressed as:
|
|
(2) |
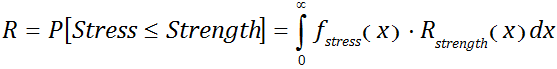
The expected reliability is calculated as:
|
|
(3) |
For cases where the limits of one of the distributions are truncated to a specified range, Eqn. (3) is adjusted as:
|
|
(4) |
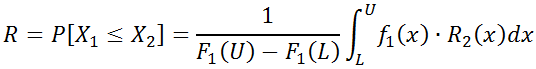
where: L ≤ X1 ≤ U, and X1 = Stress, X2 = Strength.
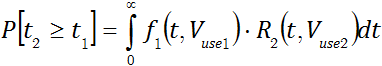
For data sets that are calculated in an Accelerated Life Testing life-stress data folio, the comparison is performed at the given use stress levels of both data sets; therefore, Eqn. (1) can also be expressed as:
|
|
(5) |