Weibull++ Version 2023 Help
 Using Life Data Folios
Weibull++'s life data
folio allows you to fit a statistical distribution to failure
time data in order to understand the reliability performance of
a product over time or to make projections about future behavior.
From the analysis, you can obtain reliability information about
a product such as probability of failure, reliability, mean life
or failure rate.
The basic steps for using a life data folio are:
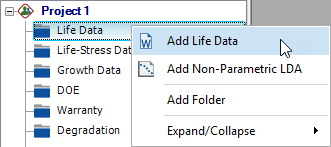
 Add
life data folio
Add
life data folio
Right-click the Life Data folder in the current project
explorer and choose Add
Life Data.
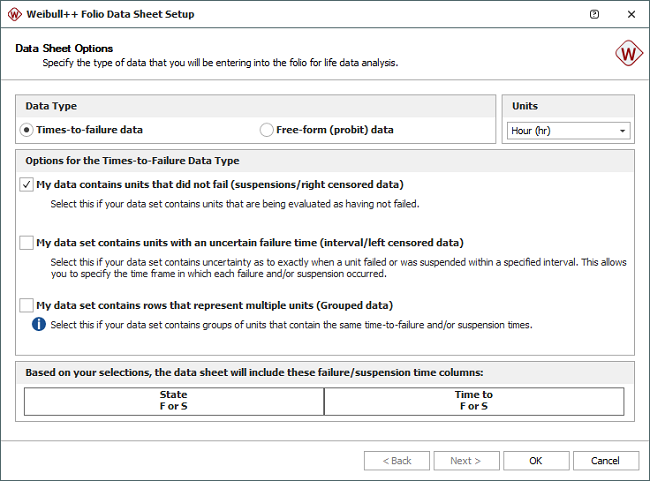
In the setup window, select the desired data type and
the units for time/usage values (hours, cycles, etc.).
(See Weibull++ Data Types.)
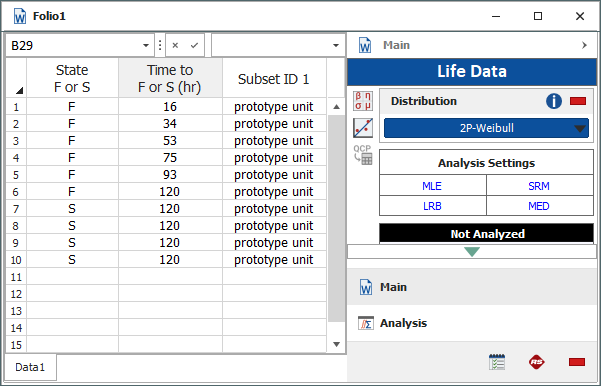
- Enter
data
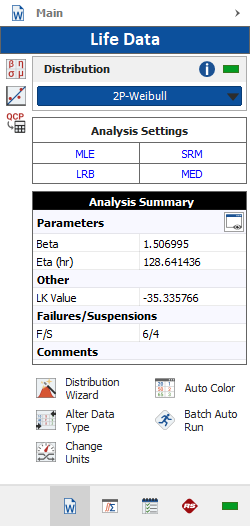
Enter the data and use the control panel to specify
the life distribution and analysis settings.
(See Life-Data
Folio Control Panel
for descriptions of all available settings.)
- Analyze
data
Click the Calculate
icon on the control panel.

The Analysis Summary area displays the parameters of
the distribution. Click the Detailed
Summary icon  to view more
information.
to view more
information.
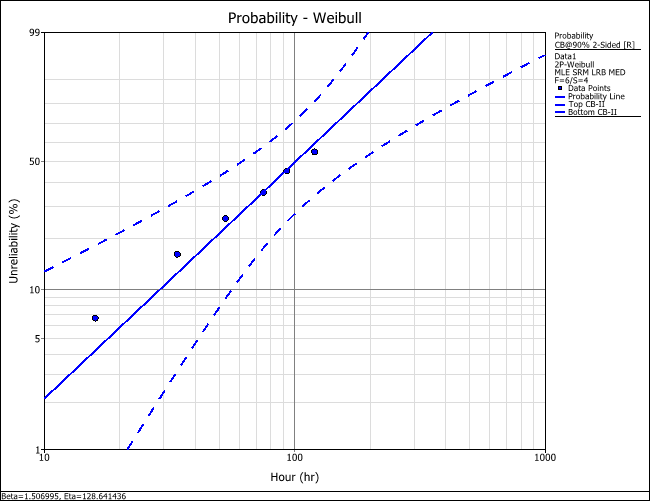
- View
plots
Click the Plot
icon on the control panel to open the plot sheet.
(See Life Data Analysis
Plots
for available plot types.)

To show the confidence bounds, click the Confidence
Bounds link on the plot's control panel, and then
set the desired type of bounds and confidence level.
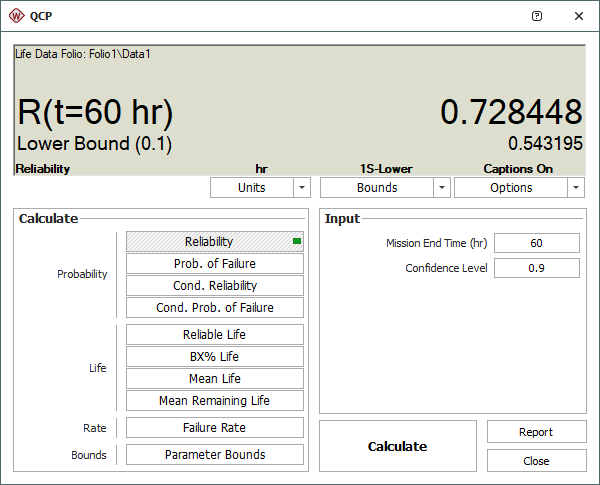
- Calculate
metrics
Click the QCP
icon on the control panel to open the Quick Calculation
Pad. (See
QCP
Calculations for Life Data Analysis
for available calculations.)

The following example shows the estimates for the reliability
and the lower one-sided 90% confidence bound.
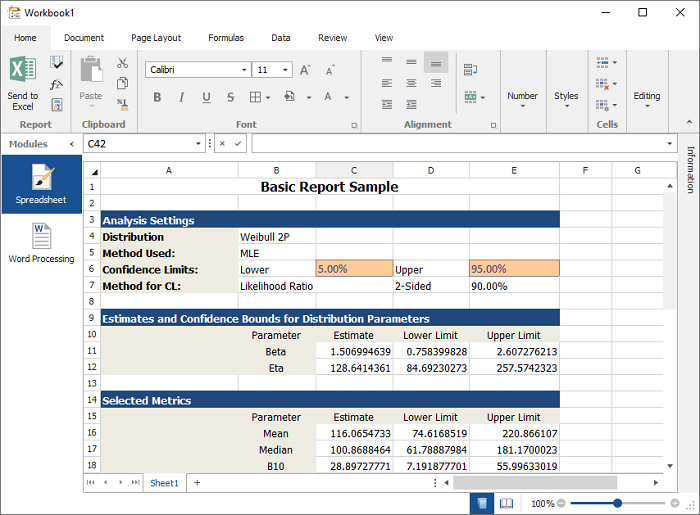
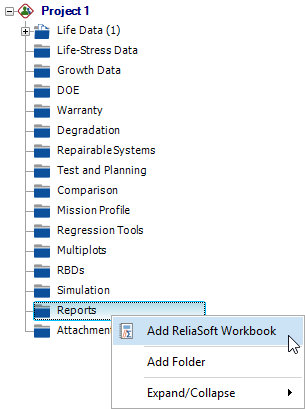
- Create
report
Right-click the Reports folder in the current project
explorer and choose Add
ReliaSoft Workbook.
In the ReliaSoft Workbook wizard, select the folio as
the default data source. If desired, you can also select
a standard or user-defined report template (e.g., the
"Weibull Summary Style 1 Template" is shown
below).
(See ReliaSoft Workbooks.)