Weibull++ Version 2023 Help
 Using Growth Data Folios
Weibull++’s growth data
folio supports traditional reliability growth analysis, repairable
systems analysis and reliability growth projections. The data
type you select determines the type of analysis you can perform.
The basic steps for using a growth data folio are:
 Add
growth data folio
Add
growth data folio
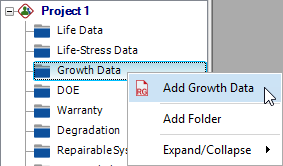
Right-click the Growth Data folder in the current project
explorer and choose Add
Growth Data.
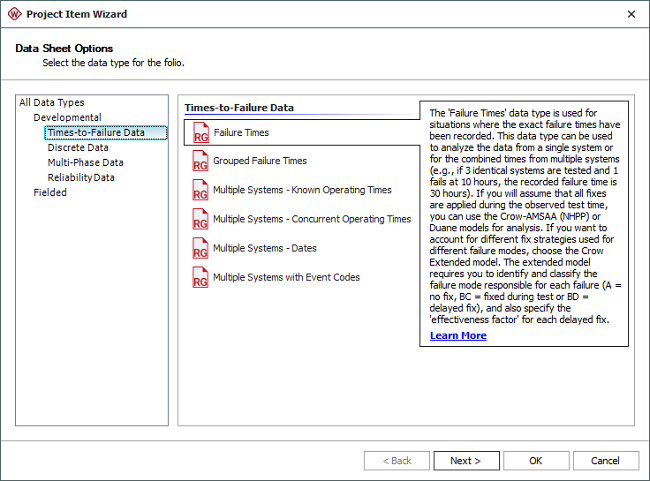
In the setup window, select the desired data type. (See
Reliability Growth Data Types.) Then click Next
to set the units for values (hours, cycles, etc.) and
other preferences.
(See Creating a Growth
Data Folio.)
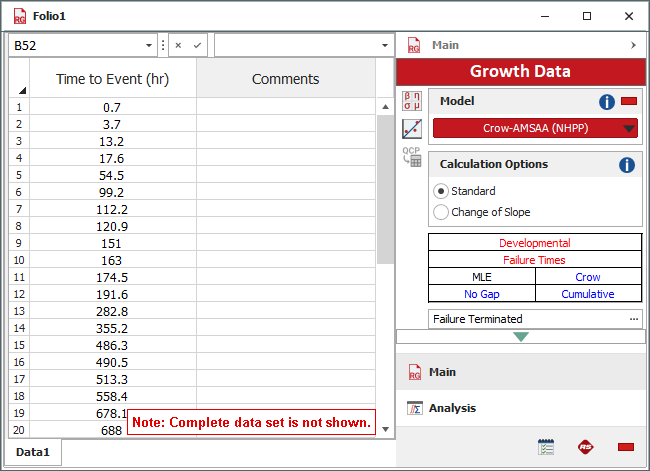
- Enter
data
Enter the data and use the control panel to specify
the growth model and analysis settings. (See
Growth Data Folio
Control Panel
for descriptions of all available settings.)
- Analyze
data
Click the Calculate
icon on the control panel.

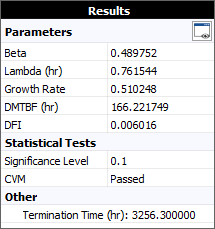
The Analysis Summary area displays the parameters of
the growth model. Click the Detailed
Summary icon  to view more information.
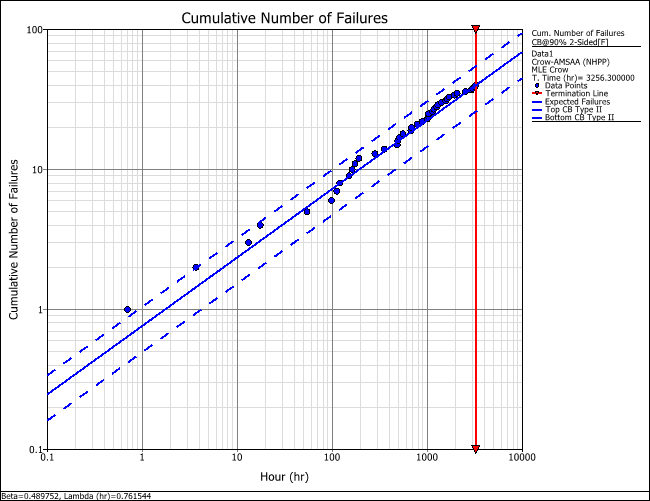
- View
plots
Click the Plot icon on the control panel to open
the plot sheet.
(See QCP
Calculations and Plots for Traditional RGA.)

To show the confidence bounds, right-click the plot,
choose Show Confidence
Bounds, and then set the desired type of bounds and
confidence level.
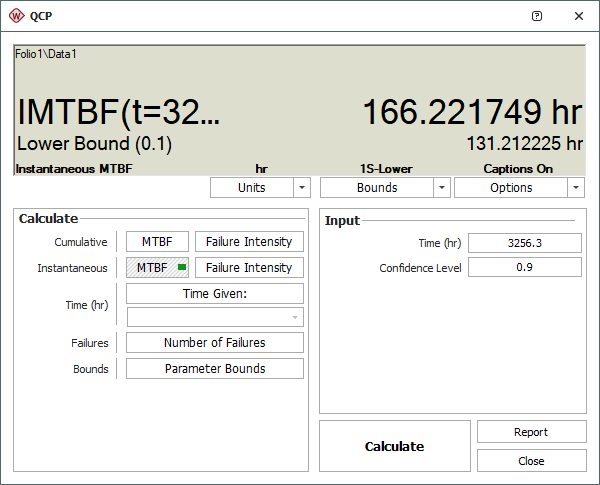
- Calculate
metrics