Free Form Folio: Control Panel
The free form folio control panel allows you to control the settings for analyzing response data and displays the results of the analysis. The panel includes the following pages:
- The Main Page contains most of the tools you will need to analyze response data.
- The Analysis Settings Page allows you to set the risk level for the analysis.
- The Comments Page allows you to enter notes or other text that will be saved with the folio.
- If you selected to analyze a life data response, the Identifiers and Publishing pages will also be available. These pages allow you to publish the results as a model.
Main Page
The Main page of the control panel includes the following tools and areas.
Folio Tools
The folio tools are arranged on the left side of the control panel. Use these tools to configure your analysis and experiment with the analysis results. Depending on the type of design you are working with, the control panel may contain some or all of the following tools:
![]() Calculate analyzes the data for each response that is selected to be included in the analysis. To exclude a response from the analysis, clear the check box in its column heading.
Calculate analyzes the data for each response that is selected to be included in the analysis. To exclude a response from the analysis, clear the check box in its column heading.
![]() Plot creates a plot based on the analysis. If you click this icon before the current data set has been analyzed, an analysis will be performed automatically.
Plot creates a plot based on the analysis. If you click this icon before the current data set has been analyzed, an analysis will be performed automatically.
![]() Modify Design opens a window that allows you to specify the properties for the factors and responses in the analysis.
Modify Design opens a window that allows you to specify the properties for the factors and responses in the analysis.
![]() Select Terms opens a window that allows you to specify the terms (i.e., factors, factorial interactions, blocks and quadratic effects) to be considered for each response.
Select Terms opens a window that allows you to specify the terms (i.e., factors, factorial interactions, blocks and quadratic effects) to be considered for each response.
![]() View Analysis Summary opens a window that contains detailed information about analysis results.
View Analysis Summary opens a window that contains detailed information about analysis results.
![]() Optimization adds an optimal solution plot to the Optimization folio that is linked to the design folio. If no linked Optimization folio exists, the software will create one.
Optimization adds an optimal solution plot to the Optimization folio that is linked to the design folio. If no linked Optimization folio exists, the software will create one.
![]() Overlaid Contour Plot adds an overlaid contour plot to the Optimization folio that is linked to the folio. If no linked Optimization folio exists, the software will create one.
Overlaid Contour Plot adds an overlaid contour plot to the Optimization folio that is linked to the folio. If no linked Optimization folio exists, the software will create one.
![]() Select Transformation opens a window that allows you to select a transformation to apply to each response.
Select Transformation opens a window that allows you to select a transformation to apply to each response.
![]() Prediction opens a window that allows you to enter values for each factor and see predicted results for the selected response.
Prediction opens a window that allows you to enter values for each factor and see predicted results for the selected response.
Settings Area
The Main page of the control panel may also contain some or all of the following settings.
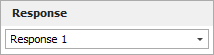
- The Response drop-down list is used to select the response that all the displayed settings and analysis results will apply to.
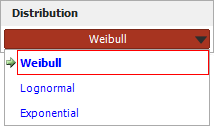
- The Distribution area is used to select a life distribution for reliability DOE. It is available when the selected response is configured as life data on the Data tab.
- The Settings area is used to view the available analysis settings. An example is shown next.
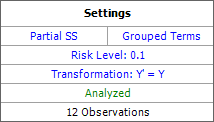
In this example:
- The partial sum of squares ("Partial SS") and grouped terms are used.
- The specified risk level is 10%.
- No transformation is used (i.e., the "transformed" response, Y', is equal to the non-transformed response, Y). To configure this setting, you can click the text or the Select Transformation icon in the folio tools.
- "Analyzed" is shown in green, which indicates that the current response data has been analyzed using the current settings. Otherwise, this would show "Modified" in red.
- The last row indicates that the analyzed data consists of 12 observations.
To configure the settings used in the analysis, click the blue text. These settings are also accessible on the Analysis Settings page of the control panel.
Analysis Summary Area
The Analysis Summary area is shown when the current response data has been analyzed using the current settings. This area displays the terms that were found to be significant, as well as their associated regression coefficients.
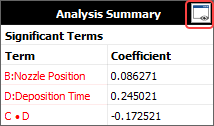
Click the View Analysis Summary icon in this area to view the details of the analysis results (including an ANOVA table).
Analysis Settings Page
The Analysis Settings page of the free form folio control panel includes additional settings that may be applicable for the current analysis. It may contain some or all of the following options (which can also be changed on the Main page of the control panel).
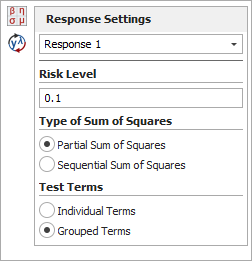
- The Response Settings drop-down list is used to choose the response that all the visible settings and analysis results will apply to. When you choose a response here, it will automatically be chosen when you return to the Main page.
- The Risk Level, or alpha value, is a measure of the risk that the analysis results are incorrect (i.e., alpha = 1 - confidence level).
- The next area allows you to specify the Type of Sum of Squares to use in the analysis. Select the Partial Sum of Squares option to test if a term is significant given that all other terms are considered in the model. Select the Sequential Sum of Squares option to test if an additional term is significant given that the terms before it are already in the model.
- The Test Terms area specifies what the information in the ANOVA table in the free form folio analysis results applies to. If you select Individual Terms, the software will separately examine the effect of each individual predictor. If you select Grouped Terms, it will treat all the predictors as a single group.