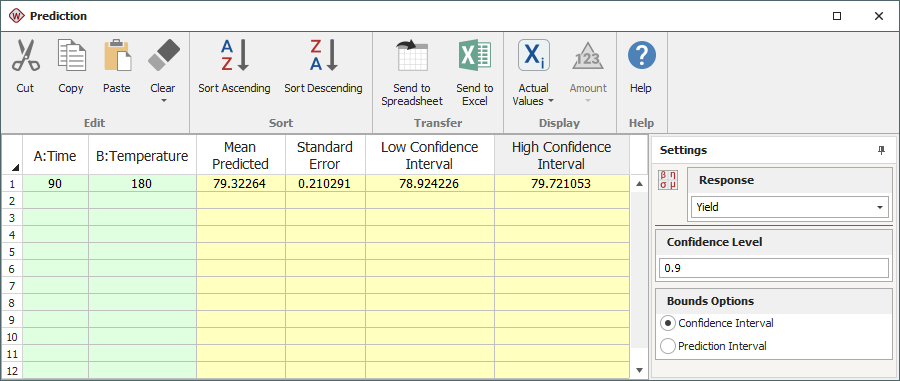
Prediction Window
The Prediction window is available after you analyze response data with at least one quantitative factor. The window allows you to enter values for each factor and see predicted results for the selected response.
The tool can be accessed from design folios, free form folios and multiple linear regression folios. To open it choose Data > Analysis > Prediction or click the icon on the control panel.
![]()
The values available for prediction in the Prediction window vary depending on whether your response values contain standard or life data. The Prediction window for standard data is shown next. The window for R-DOE looks similar, except it lacks the Bounds Options area.

Note: If the prediction is based on a reliability DOE analysis, the Publish Model button will be available on the control panel. When you click this button, the selected prediction will be used to publish the analysis results as a model. (See Publishing Models from R-DOE.)
To use the Prediction window, follow the steps outlined next:
-
First, in the green factor columns, enter the factor values that will be used to generate the prediction.
- If the design uses blocks, choose values in the Block column as well.
- You can choose to use either actual or coded values by choosing Display > [Data Type].
![]()
![]()
- For mixture designs, you can display the component factor values as amounts (e.g., 2 pounds), proportions (e.g., 0.2 = 20% of the total mixture used in the run) or pseudovalues (scaled values between 0 and 1, where 0 is the minimum possible value for the factor and 1 is the maximum possible value) by choosing Display > [Value Type].
![]()
![]()
![]()
- Note that any factors that you omit from the analysis will be hidden in this window.
- Choose the response you wish to generate predictions for in the Response drop-down list.
- In the Confidence Level field enter the level (as a decimal) that will be used to generate two-sided confidence bounds on the prediction.
-
If you're working with standard response data, use the Bounds Options area to specify the type of bounds to be displayed for the predicted value. If you are working with R-DOE, this tool will always use confidence intervals.
- If you select Confidence Interval, the value in the Mean Predicted column will be treated as a predicted mean value and bounds will be calculated accordingly.
- If you select Prediction Interval, the value in the Mean Predicted column will be treated as a predicted new observation and bounds will be calculated accordingly. The prediction interval is wider than the confidence interval because the uncertainly of the error is considered in addition to the uncertainty of the parameter(s).
-
Once you have specified all required values, click Calculate. The software will use the existing model to predict results for the currently selected response. The following columns will be populated:
-
The first column shows the predicted value. The name of this columns depends on the type of design you are working with.
- For a standard design, this is the Mean Predicted column. It may be treated as a predicted mean value or a predicted new observation value, depending on the type of bounds selected in the control panel.
-
For R-DOE, the first column will represent the characteristic life of the selected distribution:
- For Weibull, it is the Eta Predicted column. This is the predicted time at which unreliability = 63.2%.
- For lognormal, it is the Ln-Mean Predicted column. This is the predicted time at which unreliability = 50%.
- For exponential, it is the MTTF Predicted columns. This is the predicted mean life.
- Standard Error is the standard error of the predicted value (i.e., the value in the preceding column).
-
The last two columns will vary depending on the design type and/or the selected bounds option.
- The Low Confidence Interval and High Confidence Interval columns are always used for R-DOE. They are optional for other designs.
- The Low Prediction Interval and High Prediction Interval columns are not available for R-DOE. They are optional for other designs.
-
The first column shows the predicted value. The name of this columns depends on the type of design you are working with.
All entered and calculated values are retained in the Prediction window after you close it; the next time you open the window, your inputs and results will appear. To clear the entire window, click the Clear icon in the window toolbar.
The Prediction window can be sorted by any column. Select a cell in the column you wish to sort by and then choose Sort > Sort [Ascending/Descending].
![]()
![]()
The information in the Prediction window can be transferred to a spreadsheet by choosing Transfer > Send to Spreadsheet.
![]()
The information can also be saved as a Microsoft Excel® file (*.xls or *.xlsx) by choosing Transfer > Send to Excel.
![]()