Qualitative Criticality Analysis
For qualitative criticality analysis, analysts use predefined rating scales to rate the likelihood of occurrence for each failure mode and the severity of the potential effects of failure. A matrix with severity on the horizontal axis and occurrence on the vertical axis can be used to compare failure modes.
Steps to Perform Qualitative Analysis
Make sure that the applicable criticality analysis fields have been enabled for the project (on the FMEA > Criticality page of the interface style). Qualitative analysis uses Failure Probability and Severity Class, as well as Mission Phase/Operational Mode, if desired.
Define the item(s) that will be included in the analysis.
For each item, create an FMEA and define the functions, failure modes, effects and causes.
Define the following for each failure mode. These factors can be specified via the Failure Properties window, FMEA worksheet, FMRA or MIL-1629A Criticality Analysis window (if it is enabled on your computer).
Mission Phase/Operational Mode is a description of the conditions when the failure mode might occur. For example, in an airplane, a failure might occur during takeoff, while flying or during landing. This is not required for the analysis but it is usually displayed as a column in MIL-STD style reports.
Failure Probability rates the likelihood that the failure mode will occur, according to a predefined scale. The available ratings are based on the Failure Probability rating scale that has been defined for the Project Properties.
Severity Class rates the severity of the potential effects of failure, according to a predefined scale. The available ratings are based on the Severity Class rating scale that has been defined for the Project Properties.
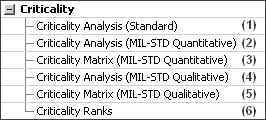
To generate a report, choose Home > Reporting > Reports to open the Reports window and select all of the items you wish to include in the analysis. Then select the desired criticality reports, which are located under the Criticality heading, as shown next.

The following reports are applicable for qualitative criticality analysis:
(4) shows the qualitative criticality analysis in a traditional tabular format.
(5) shows a matrix with the Severity Class on the horizontal axis and the Failure Probability on the vertical axis.
(These reports can also be generated from the MIL-1629A Criticality Analysis window if it is enabled on your computer.)