SUPERSYSTEM
For reliability growth data analysis only.
Description: Allows you to manually build a table that shows the failure times on the timeline of the superposition system. This applies to the Repairable Systems data type only.
Syntax: SUPERSYSTEM (Data_Src, Row, Column)
-
Data_Src is the source data sheet from which the information is taken.
- Row corresponds to the order of the data points on the timeline of the superposition system, as shown in its System Operation plot (i.e., row 1 = 1st failure, row 2 = 2nd failure, etc).
- Column is an index value
(from 1 to 4) that returns the following information:
- 1 = returns the failure time.
- 2 = returns the cumulative number of failures.
- 3 = returns the mode classification (for the Crow Extended model only).
- 4 = returns the failure mode (for the Crow Extended model only).
Remarks:
-
The Data_Src can be one of the following values:
-
A default data source selected from the Data Source Index drop-down list.
-
A data sheet name (e.g., "Weibull!Folio1!Data1").
-
A variable name defined in the Defined Names window (e.g., datasource).
-
-
The Row and Column values must be greater than 0.
Example:
The following table is for a particular data set analyzed with the Crow Extended model. It shows the failures on the timeline of the superposition system (i.e., row 1 = 1st failure, row 2 = 2nd failure, etc), the cumulative number of failures to be expected at each time, and the classification and mode that each failure is associated with.
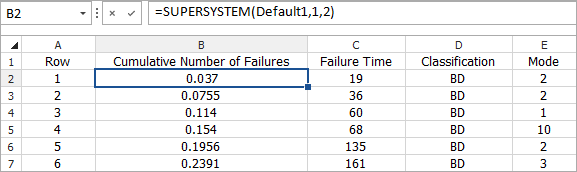
Note that the values depend on the source data set.