Crow Extended Analysis Results
For reliability growth data analysis only.
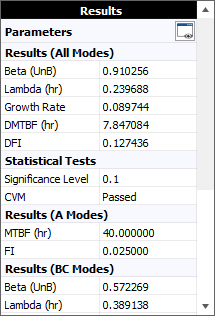
When you calculate a data sheet using the Crow Extended model, the analysis results will be displayed in the Results area on the control panel. The results that apply to all failure modes are displayed first. Use the scroll bar to see results that only apply to failure modes with a particular classification (i.e., A Modes = not fixed, BC Modes = fixed during observation period or BD Modes = fixed after observation period), as shown next.
When you use the Crow Extended model, the results may include the following:
- Beta and Lambda are the two parameters
of the Crow Extended model.
-
If beta < 1, the reliability improved during
the observation period. If beta > 1, the reliability
deteriorated. In addition:
- If the data set does not include BC modes, Beta (hyp) will indicate that the model assumes beta = 1 (i.e., the reliability neither improved nor deteriorated). If this value is shown in red, then the 90% two-sided confidence bounds on beta do not include 1, which means this assumption may not be valid.
-
When working with times-to-failure data,
Beta (Unb) indicates
that the unbiased MLE estimate of the beta parameter
was calculated.
Note that the preference to display Beta (hyp) and/or calculate Beta (Unb) is set on the Calculations page of the Application Setup window for all new folios or in the Settings tab of the Items Properties window for existing folios.
-
If beta < 1, the reliability improved during
the observation period. If beta > 1, the reliability
deteriorated. In addition:
- If the data set includes BC failure modes, the Growth Rate will also be displayed, which is equal to 1 - beta. A positive value means the MTBF is improving, and larger values mean faster growth.
- The metrics used to describe the reliability at the
end of the observation period will vary depending on the data
type you are working with.
- If you're working with times-to-failure or fielded data, the results will show the mean time between failures and the failure intensity at the end of the observation period. An option on the Calculations page of the Application Setup window (for all new folios) or in the Settings tab of the Items Properties window (for existing folios) determines whether you prefer to call these values "demonstrated" (DMTBF and DFI) or "achieved" (AMTBF and AFI).
- If you're working with Discrete Mixed data, the results will show the demonstrated reliability (DRel) and demonstrated failure probability (DFP), which is 1 - DRel.
- The Statistical Tests
area shows whether the data set passed or failed the applicable
goodness-of-fit tests that are performed automatically when
you calculate the parameters.
- For failure times and grouped failure times, this will be the Cramer-von Mises test (CVM).
- For mixed data, it will be the chi-squared test (Ch-Sq).
- For data from multiple systems, this area may also show the results from the common beta hypothesis (CBH) and/or the Laplace Trend test.
See Statistical Tests for more information.
- Depending on the data type, the Other
area may display the Termination
Time:
- If you are using the Failure Times, Grouped Failure Times or Multiple Systems - Known Operating Times data types, you can use the Termination Time window to specify whether this is the time of the last observed failure, or a specific time that you enter.
- For all other data types that can be analyzed with the Crow Extended model, the termination time is the end of the observation period.
- Finally, if you are working in a data sheet that supports
the Advanced
Systems View, the following information will also be displayed.
- The Other area will show the number of systems that were included in the analysis (e.g., 4/6 means four out of six systems were analyzed). You can omit a system from the analysis by clearing its check box on the Systems panel while the data sheet is in Advanced Systems View.
- The control panel will show two sets of results: the larger table at the top shows the results for the equivalent system (which represents the combined operating hours of the systems), and the smaller table at the bottom show the results for the individual system that is currently selected in the data sheet. The specific system name is shown in the heading of this table.
Note: If the result of the analysis is associated with a published model, then the model's name will appear as a link at the bottom of the Results area. Click the link to view the model's properties. For details on how to publish the results as a model, see Publishing Models.