Analysis Results for Multi-Phase Data
For reliability growth data analysis only.
When you calculate a multi-phase data sheet with the Crow Extended – Continuous Evaluation model, the following results will be displayed on the Main page of the control panel. By default, the Results area displays the results from all failure mode classifications first. Use the scroll bar to see results that only apply to failure modes with a particular classification (A, BC and BD), as shown next.
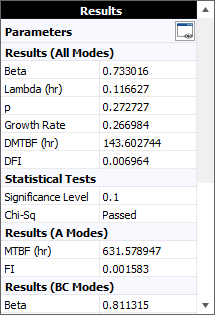
- Beta, Lambda and p
are the three parameters of the Crow Extended - Continuous
Evaluation model.
- If beta < 1, the reliability improved during
the observation period. If beta > 1, the reliability
deteriorated. In addition:
- If the data set does not include any failure modes that were fixed before the end of the last test phase (such as BC modes), Beta (hyp) will indicate that the model assumes beta = 1 (i.e., the reliability neither improved nor deteriorated). If this value is shown in red, then the 90% two-sided confidence bounds on beta do not include 1, which means this assumption may not be valid.
- When working with times-to-failure data, Beta (UnB) indicates
that the unbiased MLE estimate of the beta parameter
was calculated.
Note that the preference to display Beta (hyp) and/or calculate Beta (UnB) is set on the RGA Growth Data Folios page of the Application Setup window for all new folios or in the Settings tab of the Items Properties window for existing folios.
- The p value is the probability that the corrective action for an observed BD failure mode will occur after the end of the last test phase. In other words, for every new BD mode that is discovered during the test, p is the probability that its corrective action will be delayed until after the test.
- If beta < 1, the reliability improved during
the observation period. If beta > 1, the reliability
deteriorated. In addition:
- The Growth Rate is equal to 1 - beta. A positive value means the MTBF is improving, and larger values mean faster growth.
- The metrics used to describe the reliability at the
end of the observation period will vary depending on the data
type.
- For failure times and grouped failure times, the results will show the mean time between failures and the failure intensity at the end of the observation period. An option on the Calculations page of the Application Setup window (for all new folios) or in the Settings tab of the Items Properties window (for existing folios) determines whether you prefer to call these values "demonstrated" (DMTBF and DFI) or "achieved" (AMTBF and AFI).
- For mixed data, the results will show the demonstrated reliability (DRel) and demonstrated failure probability (DFP), which is 1 - DRel.
- The Statistical Tests area shows whether the data set passed or failed the applicable goodness-of-fit test that is performed automatically when you calculate the parameters. For failure times and grouped failure times, this will be the Cramer-von Mises test (CVM). For mixed data, it will be the chi-squared test (Ch-Sq). (See Statistical Tests.)
- For failure times and grouped failure times data sheets, the Termination Time is the time of the last data point that is not excluded from the analysis. If this is the end of a phase (PH) or an analysis point (AP), the folio performs a time-terminated calculation. If this is a failure time (F, P or Q), it will be failure-terminated. This is not applicable for mixed data sheets.
Note: If the result of the analysis is associated with a published model, then the model's name will appear as a link at the bottom of the Results area. Click the link to view the model's properties. For details on how to publish the results as a model, see Publishing Models.