Reliability Data Warehouse (RDW)
The Reliability Data Warehouse (formerly called the "Synthesis Data Warehouse (SDW)") enables you to access data from an XFRACAS failure reporting system for the purpose of life data analysis or repairable system/reliability growth analysis. You can also set up custom connections to obtain reliability-related data from external data sources (including Access, Oracle and SQL Server). You can also get data directly from custom reports created in XFRACAS.
You can then transfer the data to an analysis folio, or use the flexible Dashboard utility to explore and present the data in a variety of graphical charts and grids. (See Transferring from the RDW to an Analysis Folio or RDW Dashboards.) In addition, if an SEP web portal has been implemented for an enterprise database, users can also access RDW dashboards from any web-enabled device.
To open the RDW, choose Home > ReliaSoft > Reliability Data Warehouse.
![]()
Managing Data Sources
The available data sources are listed in the data source manager on the left side of the window. They may include:
Static data collections that were extracted from XFRACAS at a particular point in time (and will not change if incidents are later added or updated). (See Extracting Data from XFRACAS.)
Custom connections that have a live link to a specified external database or to a predefined report created in XFRACAS. (See Custom Connections in the RDW.)
Static data collections that were extracted from a custom connection at a particular point in time (and will not change if the original data source changes). (See Import to a Static Data Collection.)
If you are working with a long list of available data sources, this panel can utilize the same categories, identifiers and item filters that are available in many other locations throughout ReliaSoft desktop applications.
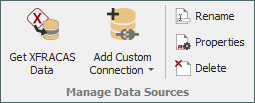
To create, delete, rename or edit the properties for these data sources, use the Manage Data Sources commands, or right-click inside the panel.

The Properties window allows you to enter identifiers for each data source, and to view its history.
Built-in Find/Filter, Configuration and Grouping Tools
Double-click any data source to display the data in a grid on the right side of the window. The RDW offers the same filter, column configuration and grouping tools that are built in to other utilities that use a similar grid (e.g., the Analysis Explorer, Actions Explorer, etc.). For details about how to use each feature, see:
Building the Data Set
The "Include in Analysis?" column shows whether each row will be included in the data set when it is transferred to a folio.
Include: Data points that will be included in the analysis are shown in green.
Invalid: In XFRACAS data collections, incidents with a State Time of less than 0 are automatically set to invalid and will not be included in the analysis. These rows are shown in red.
Ignore: In XFRACAS data collections, incidents with a State Time of 0 that are marked as suspensions in the State FS column are automatically set to ignore and will not be included in the analysis. These rows are shown in gray.
Exclude: Data points that have been manually set to exclude from the analysis are shown in blue.
To view only those rows that will be transferred to a folio, choose View > Show Only Included. You can toggle this command off to show all records.
![]()
To change the status for a specific data point before transferring data to a folio, select the row and choose Build Data Set > Include or Build Data Set > Exclude.
Include |
|
Exclude |
Note: Changes to the "Include in Analysis?" indicator will not be saved with the data source. If you close the data source and open it again later, and if you view a dashboard in the SEP web portal, the data will not reflect changes that were applied manually.
In XFRACAS data collections, and only if you have permission to view incidents in the XFRACAS entity that the data were extracted from, you can select a row and choose Build Data Set > View XFRACAS Incident to open the incident in your web browser.
![]()