Throughput Analysis
Throughput is the amount of output that can be processed in a given period of time. To understand system throughput, consider this example: Assume that each component in the system processes (or makes) something while operating. The RBD shown next contains two components in series, each processing/producing 10 and 20 items per unit time (for explanation purposes, we will call that "ipu") respectively.
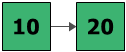
In this case, the system configuration is not only the system's reliability-wise configuration but also its production/processing sequence. In other words, the first component processes/produces 10 ipu and the second component can process/produce up to 20 ipu. However, a block can only process/produce items it receives from the blocks before it. Therefore, the second component in this case is only receiving 10 ipu from the block before it. If we assume that neither component can fail, then the maximum items processed from this configuration would be 10 ipu. If the system were to operate for 100 time units, then the throughput of this system would be 1,000 items, or (100 x 10).
Throughput analysis can be performed for simulation RBDs. Results are available at the block and system levels, taking into account the reliability and maintenance properties of the blocks and the system. In order to perform throughput analysis, you must specify throughput properties in the Block Properties window for the relevant blocks and select the Run Throughput Simulation option on the Analysis Settings page of the diagram's control panel.
Note: While throughput analysis is not available for fault trees, fault trees may be used as subdiagrams for simulation RBDs. To perform throughput analysis in this case, you would define throughput properties for the subdiagram in the Block Properties window for the subdiagram block. In simulation, the fault tree is simulated and determined to be up or down. If it is down, no throughput is passed to the next block in the RBD; if it is up, then the throughput properties defined for the subdiagram block determine the amount of throughput passed to the next block.
In many real-world cases, throughput can change over time (i.e., throughput through a component is not a constant, but a function of time). You can model variable throughput using phase diagrams.
Throughput and Mirrored Blocks
Simulations that contain both mirrored blocks and throughput analysis behave in the following way:
- System availability: All blocks within a mirror group will be considered the same block for system uptime/downtime analysis. This means that if the block fails, it will be considered a downed block everywhere that the mirrored block is found.
- System throughput: The mirrored block throughput is NOT divided between each of the locations within the system diagram. Each instance of the mirrored block can process the amount of throughput assigned to the block.
Example
Imagine a system where block A and block C each have a throughput of 300 units/hour, while block B (mirrored block) and block D each have a throughput of 100 units/hour.
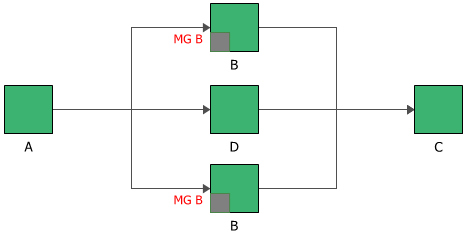
If all the blocks are operating, then the system throughput is 300 units/hour, as each instance of block B is able to handle 100 units/hour.
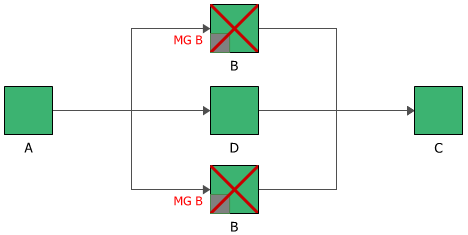
If block B is down, then the system throughput becomes 100 units/hour, as block B is considered down at both locations.