Simulation Diagram Control Panel
The control panel associated with simulation diagrams consists of multiple pages, each containing options for performing particular tasks. This topic focuses on the Simulation, Analysis Settings and Drag and Drop URDs pages of the simulation diagram control panel, which contain most of the tools you will need to build and simulate a diagram. For more information about the control panel in general, see Control Panels.
Control Panel Simulation Page
The Simulation page of the control panel for simulation diagrams contains the following options:
- The Simulation area displays the status and results of the simulation.
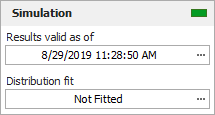
- Status If the light is green, then the simulation has been performed. If the light is red, then the simulation has not been performed. A simulated diagram will remain in the simulated state unless a change is made to the diagram (e.g., a block is added, a connector is removed, a model is changed, etc.).
- Show Simulation Details (...) displays the most recently generated simulation results in the Results Explorer.
- Distribution fit displays the distribution that has been fitted to the simulation results. Click the button (...) to open the Distribution Estimator to fit a distribution and/or for information on the fitted distribution parameters. The fitted distribution can be used to describe the overall behavior of the system and can be published for use as a model elsewhere in the project.
- The Information area displays information about the diagram or the currently selected block. If no block is selected in the diagram, the Information area displays the number of blocks in the diagram and information about the diagram creation and last modification; in addition, if the diagram results have been published as a model, the status of the model will be shown and an icon that takes you to the Publishing page of the control panel will appear. If a block is selected in the diagram, it displays a subset of the properties found in the Block Properties window. Items in the table that are resources (e.g., models, switches, etc.) are links; you can click such items to view and/or edit their properties. In both cases, this area also offers a Comments field; click the field heading to enter comments. For blocks, these comments are also accessible in the Identifiers properties in the Block Properties window.
- The Tools area on the left side of the control panel gives you quick access to the tools you will need to analyze the diagram and generate additional results.
![]() Simulate opens
the Maintainability/Availability
Simulation window, which allows you to obtain reliability,
maintainability, availability and throughput results from simulations.
Simulate opens
the Maintainability/Availability
Simulation window, which allows you to obtain reliability,
maintainability, availability and throughput results from simulations.
![]() Plot creates
a plot based on the simulation results. Clicking the Plot
icon before the diagram has been simulated will automatically
perform the simulation and then plot the data.
Plot creates
a plot based on the simulation results. Clicking the Plot
icon before the diagram has been simulated will automatically
perform the simulation and then plot the data.
![]() Simulation QCP
opens the simulation
Quick Calculation Pad (QCP). The QCP allows you to obtain
reliability, maintainability and availability metrics based on
the simulation results.
Simulation QCP
opens the simulation
Quick Calculation Pad (QCP). The QCP allows you to obtain
reliability, maintainability and availability metrics based on
the simulation results.
![]() Change Diagram Type
changes the current diagram to the opposite diagram type (i.e.,
changes the current analytical diagram to a simulation diagram,
or the current simulation diagram to an analytical diagram). Note
the following:
Change Diagram Type
changes the current diagram to the opposite diagram type (i.e.,
changes the current analytical diagram to a simulation diagram,
or the current simulation diagram to an analytical diagram). Note
the following:
- Your most recent selection for the Perform the same change to any subdiagrams option in the Change Diagram Type window (accessible by right-clicking this icon or via the Diagram Actions > Change Diagram Type command) will be used in this change.
- If you create an analytical diagram from a simulation diagram, by either duplication or conversion, the maintenance and throughput characteristics defined in the simulation diagram will not be displayed in the analytical diagram, as they are not relevant to the analysis. However, the properties are not lost, and if you then create a simulation diagram from that analytical diagram, all original properties will be retained.
- If you prefer to create a new diagram using the new type, use the Change Diagram Type window instead.
Control Panel Analysis Settings Page
The Analysis Settings page of the control panel for simulation diagrams contains the following options:
- Analysis Settings
- Select Report subdiagram results to provide calculated results for subdiagram blocks in the Results Explorer and certain plots. If this check box is not selected, subdiagram blocks will not appear in the results.
- Use system downtime threshold allows you to specify a minimum amount of time that the system must be down in order for it to count toward critical downtime metrics.
- Select Run throughput simulation to perform the throughput simulation, which allows you to perform analyses on the number of units that can be processed by the system in the diagram during the simulation time. If you select to run a throughput simulation, you can select Report throughput point results to include throughput results in the System Point Results worksheet, which provides results at specified points in time. If this check box is not selected, only the throughput results for the system at the simulation end time will be reported.
- Report Settings
- Report folio model allows you to specify the results model that will be used when the diagram is used as the default data source for a ReliaSoft Workbook. You can choose to use either the simulation results or the fitted model.
- Max RDA data allows you to specify the maximum number of events that can be shown in the RDA Data worksheet in the Results Explorer. The contents of the RDA Data worksheet can be transferred to a parametric RDA folio in Weibull++ for further analysis.
- System Level Costs
- Cost per System Downing Eventallows you to specify, for every event that brings the system down, a cost per incident at the system level (i.e., an additional cost that is not accounted for by any of the block level costs).
- System Downtime Rate allows you to specify a cost per unit time for downtime at the system level (i.e., an additional cost that is not accounted for by any of the block level costs).
- System Level Revenue
- Revenue per [Unit] of Uptime allows you to specify an amount of revenue that is brought in by the system for each unit of uptime. This can then be accounted for as a loss when the system is down.
- Revenue per Unit Produced allows you to specify an amount of revenue that is brought in for each unit produced. This can then be accounted for as a loss when the system is down. This option is available only when you have selected the Run throughput simulation option in the Analysis Settings area of this control panel page.
Control Panel Drag and Drop URDs Page
The Drag and Drop URDs page is available in the control panel for analytical and simulation diagrams, including fault trees. It provides a list of the URDs that are available for use by blocks in the diagram. Drag a URD into the diagram to create a standard block/event that uses the URD.
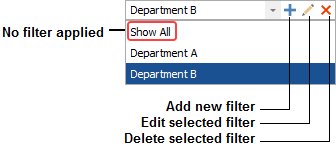
The list of URDs can be filtered using the same resource filter that is available in many other locations throughout ReliaSoft desktop applications.