Maintainability/Availability Simulation Window
BlockSim's simulations are based on the component characteristics and the reliability-wise system configuration of the diagram. To simulate a diagram, choose Simulation > Simulation > Simulate or click the Simulate icon.
![]()
The Maintainability/Availability Simulation window will open. This window allows you to specify the settings to be used in simulating an RBD or fault tree.
The Analysis Settings link at the bottom of the Maintainability/Availability Simulation window displays a message that shows the settings you have specified on the Analysis Settings page of the diagram's control panel. These settings determine whether subdiagram results will be included in the results; whether a throughput simulation will be performed and, if so, whether point results will be reported; and whether a system downtime threshold has been specified. You can edit these settings via the diagram's control panel.
The area at the top of the Maintainability/Availability Simulation window displays the status of the simulation.
During simulation, you can click Cancel to stop the simulation at the current point. The results will be provided for the simulations (if any) that were completed before you stopped the process. When simulation is complete, you can click the Details button to view the results of the simulation in the Results Explorer. Click the Simulate button to re-run the simulation.
Note: Once you have simulated a diagram, the settings you have specified in the Maintainability/Availability Simulation window are saved along with the diagram so that you or another user can easily simulate the diagram again using the same settings. The first time you simulate a diagram, the settings default to the settings used for the last simulation that was performed on your computer.
Choosing a Simulation Type
There are two basic types of simulation that you can perform: standard simulations and log of simulations.
- When you perform standard simulations, the metrics in the Results Explorer are obtained by calculating the average of the results from all of the simulation runs.
- Saving a log of simulations, on the other hand, provides a set of individual simulation results that can be used to analyze variability within the simulation results and a set of average results in the Results Explorer.
For more information about how you might use the log of simulations, please read "An Application of BlockSim's Log of Simulations" at: http://www.weibull.com/hotwire/issue97/relbasics97.htm. (Note that this article uses BlockSim 7, but the theory remains the same.)
In addition to having different purposes, the simulations are based on different randomly generated numbers. To understand this, suppose you are interested in the reliability/maintainability performance for a system and you want to use simulation to estimate useful metrics, such as the mean availability and the total expected downtime after 1,000 hours of operation.
Assume that you run 100 simulations for the 1,000 hour mission time using standard simulations and a seed of 1. In this case, the simulation routine will draw from a single stream of randomly generated numbers, generated using the seed of 1, for the series of 100 simulations. Therefore, the results will be reproducible if you perform the exact same set of simulations again, using the same seed, for the exact same diagram.
Now suppose that you want to perform a more in-depth exploration that will help you to analyze the variability within the simulation results. For that purpose, let's assume that you select to save a log of simulations using 100 seeds with a starting seed of 1. BlockSim will perform one simulation using the seed of 1, then will increment the seed by 1 and perform a second simulation using a seed of 2 (1 + 1 = 2), and so on until the utility has performed 100 separate simulations. In this case, each simulation draws from a separate stream of randomly generated numbers. The first simulation will utilize a stream with seed = 1, the second simulation will utilize a stream with seed = 2, and so on. Because of this, the average results that are shown in the Results Explorer when you have selected to save a log of simulations will not be the same as those that are shown when you have performed basic simulation.
To perform each of these types of simulation, select the simulation type in the Advanced Options drop-down menu and then specify the simulation settings.
Specifying the Simulation Settings
For all simulation types, you will do the following:
- Enter the Simulation End Time. Specify the time and the units of time used. Unless you have selected the Standard Simulations - Interval simulation type, simulations begin at time = 0. In these cases, the simulation end time is equivalent to the duration of the simulation.
- In the Point Results Every field, specify the frequency at which the simulation will return results. For example, if you have entered 100 hours in the Simulation End Time field and you enter 10 hours in the Point Results Every field, the simulation will run from 0 to 100 hours and point results will be available at 10 hours, 20 hours, 30 hours and so on.
- If you need your results to be repeatable, you will
use a seed to specify a starting point from which the random
numbers used in simulation will be generated. The same random
numbers and, therefore, the same simulation results will be
generated when the same seed value is used.
- For standard simulations, select the Use a Seed check box in the Advanced Options drop-down menu and enter a seed.
- For a log of simulations, select the Use Starting Seed check box in the Advanced Options drop-down menu and enter the seed to be used for the first simulation. BlockSim will perform one simulation using the starting seed, then will increment the seed by 1 and perform a second simulation using that seed and so on until the utility has performed the number of simulations specified in the Number of Seeds field.
- New in Version 2020, you can specify task types to exclude from the simulation, allowing you to create results and plots for a certain set of conditions. For example, you might exclude all preventive tasks to get a sense of how a corrective-only maintenance strategy differs from one incorporating preventive maintenance. To exclude task types, simply select the relevant check box(es) in the Comparative Options drop-down menu. You can exclude all corrective tasks, inspection tasks (not including the inspection portion of on condition tasks), preventive tasks and/or on condition tasks. If any task type is selected for exclusion, a warning light will be displayed on the Comparative Options menu in this window. Additionally, the exclusion will be indicated in the simulation plots, the System Overview results worksheet and the FMRA (if applicable).
The remaining settings depend on the type of simulation you are running.
Standard Simulations
For standard simulations with a fixed number of simulations:
- Enter the Number of Simulations to be performed.
For standard simulations with a variable number of simulations:
- Specify the Maximum Number of Simulations to be performed.
- In the Convergence Criteria field, specify the standard deviation for a key simulation result. The simulation will continue until this standard deviation target is reached in the simulation results or until the maximum number of simulations have been performed, whichever comes first.
For standard simulations over a specified interval of time:
- Enter the Simulation Start Time. Specify the time and the units of time used. The simulation duration will be equal to Simulation End Time - Simulation Start Time.
- Enter the Number of Simulations to be performed.
Log of Simulations
- Specify the Number of Seeds to be used (i.e., the number of simulations).
- Click the Select Results link to open the Select Results window, which allows you to select the items you want to log individual simulation results for and select which results for those items you want to save in the log.
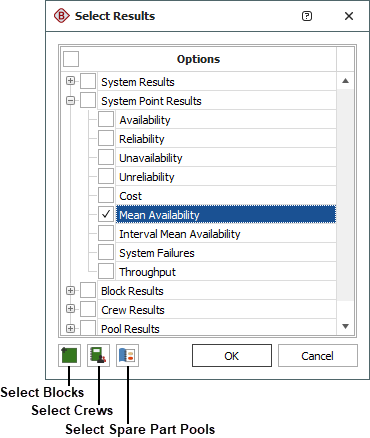
In the Options area, you can select or clear individual results or select/clear the check box for a result category to select/clear all of the results in that category. You also can select or clear all results by selecting/clearing the Options check box.
In the lower left corner of the window, click the button corresponding to the desired item type to open a window that allows you to select the items of that type for which results will be saved in the log. For example, click Select Blocks to open the Select Blocks window. To select a block so that results for it will be saved in the log, select the box next to the block's name and click OK. Selecting or clearing the check box beside the category name will select or clear all of the items.
If you have selected to save a block result, crew result or pool result, you must specify at least one item of the corresponding type to save results for. For example, if you have selected to save block downtime results but have not selected any blocks to save results for, a warning message will appear telling you that there are no results to be displayed. Click OK and select a block.
- In the Log of Simulations Results area, select whether you want the log sent to Excel or saved as a tab-delimited text file. If you save the log as a tab-delimited text file, you can choose to save it as an embedded attachment within the project or you can click Browse to specify an external location and filename for the file.
About Threads
For any simulation type, you can run simulations in multiple threads, which may improve performance and save time when simulating complex diagrams. The Number of Threads field in the Advanced Options drop-down menu allows you to specify the number of threads to use for simulation. In general, using twice as many threads as the number of cores in your computer is appropriate; a ratio of threads to cores greater than this 2:1 ratio is likely to degrade performance. To have the application automatically determine the number of cores in your system and set the number of threads accordingly, click the Calculate icon beside the Number of Threads field.
![]()
The number of threads you use affects repeatability of results. In order for your results to be repeatable, you must use the same number of threads and the same seed each time you simulate the diagram. When you are using multithreading, the seed that you specify in the Advanced Options drop-down menu is the seed for the first thread; seeds for additional threads are sequential (e.g., if you are using 3 threads and your starting seed is 7, the threads will use 7, 8 and 9 as the starting points for random number generation).