Markov Diagram Results
Results from discrete and continuous Markov diagrams are shown in worksheets in the Results Explorer. To access the results, click the Show Results (...) icon on the control panel or choose Analysis > Tools > Show Analysis Results.

![]()
Analysis Summary Worksheet
 Diagrams
Without Phases
 Diagrams
with Phases
Result Summary Worksheet
In diagrams using phases, the results in the Result Summary worksheet are calculated at the end of the analysis, not at the end of a single cycle.
- State Name: The name of the state block.
- Initial Probability: The initial probability value specified for the state block (i.e., the probability that the system will be in the state at the start of the analysis).
- Mean Probability: The mean probability of the system being in the state over the course of the analysis.
- Point Probability: Discrete diagrams only. The probability of the system being in the state at the end of the analysis.
- Point Probability (Av) and Point Probability (Rel): Continuous diagrams only. The probability that the system is in this state at the end of the analysis. (Av) includes return from unavailable states. (Rel) assumes no return from unavailable states.
- Steps Spent in State (discrete diagrams) or Time Spent in State (continuous diagrams): The number of steps or the amount of time during which the system was in this state.
- Cost: Continuous diagrams only. The costs accrued during analysis, based on the cost specified for just this state block.
Transition Probability/Rate Matrix Worksheet
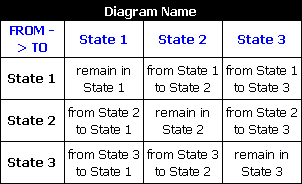
The Transition Matrix worksheet provides information on the transitions in the Markov diagram in a tabular format, as shown next.

For discrete diagrams, the values in the matrix are probabilities. For continuous diagrams, they are failure rates; consequently, no values are given for remaining in the same state.
In diagrams using phases, one matrix is shown for each phase, in the order in which the phases were analyzed.
System Point Results Worksheet
The System Point Results worksheet is available only for continuous Markov diagrams. If the diagram uses phases, the worksheet will present a separate table for each phase, in the order in which the phases were analyzed. If a given phase is performed (in whole or in part) more than once, an additional table will be provided for each time it is performed.
- Calculation Point: The index number for the step.
- Time: The step size (time) for the analysis is determined iteratively as the analysis is performed.
- A(t) and (1-A(t)): The point availability and point unavailability of the system at the given time.
- R(t) and (1-R(t)): The point reliability and point unreliability of the system at the given time.
State Point Results Worksheet
If the diagram uses phases, the State Point Results worksheet will present a separate table for each phase, in the order in which the phases were analyzed. If a given phase is performed (in whole or in part) more than once, an additional table will be provided for each time it is performed.
Discrete:
- Step: The index number for the step.
- P(t): The point probability of being in the state at that step.
- 1-P(t): The point probability of not being in the state at that step.
Continuous:
- Calculation Point: The index number for the step.
- Time: The step size (time) for the analysis is determined iteratively as the analysis is performed.
- Point Probability(Av)(t) and 1-Point Probability(Av)(t): The probability of being in the state, and of not being in the state, at the given time, when return from unavailable states is considered.
- Point Probability(Rel)(t) and 1-Point Probability(Rel)(t): The probability of being in the state, and of not being in the state, at the given time, when return from unavailable states is ignored.