System Reliability Analysis
An Overview of Basic Concepts
In life data analysis and accelerated life testing data analysis, the objective is to obtain a life distribution that describes the times-to-failure of an item. (For more details, see ReliaSoft's Life Data Analysis Reference and ReliaSoft's Accelerated Life Testing Reference.) This analysis is based on the time of successful operation or time-to-failure data of the item, either under use conditions or from accelerated life tests.
For any life data analysis, the analyst chooses a point at which no more detailed information about the object of analysis is known or needs to be considered. At that point, the analyst treats the object of analysis as a "black box." The selection of this level (e.g., component, subassembly, assembly or system) determines the detail of the subsequent analysis.
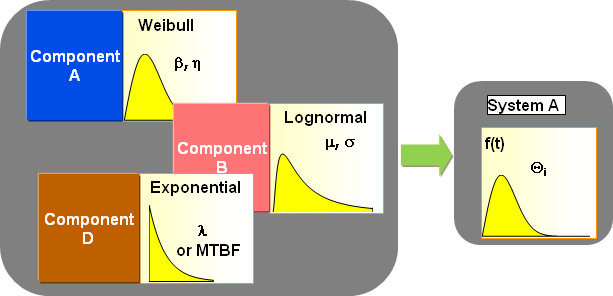
In system reliability analysis, we construct a "system" model from these component models. In other words, we are concerned with the construction of a model (life distribution) that represents the times-to-failure of the entire system based on the life distributions of the subsystems, assemblies and/or components ("black boxes") from which it is composed.
Systems
A system is a collection of subsystems, assemblies and/or components arranged in a specific design in order to achieve desired functions with acceptable performance and reliability. The types of components, their quantities, their qualities and the manner in which they are arranged within the system have a direct effect on the system's reliability. Therefore, in addition to the reliability of the components, the relationship between these components is also considered and decisions as to the choice of components can be made to improve or optimize the overall system reliability, maintainability and/or availability. This reliability relationship is usually expressed using logic diagrams, such as reliability block diagrams (RBDs) and/or fault trees (see also Fault Tree Analysis).
Reliability Block Diagrams (RBDs)
Block diagrams are widely used in engineering and science and exist in many different forms. For the purposes of system reliability analysis, they can be used to describe the interrelation between the components and to define the system. When used in this fashion, the block diagram is referred to as a reliability block diagram (RBD). A reliability block diagram is a graphical representation of the components/subsystems of the system and how they are reliability-wise related (connected). It should be noted that this may differ from how the components are physically connected. For example, consider the drivetrain in a two-wheel drive car. The configuration in which the transmission, driveshaft, differential, axles and wheels are physically connected is quite different from their reliability-wise configuration; even though the tires and axles are parallel on the road, they are all needed to operate the car properly and are therefore in series in terms of reliability.


Each block represents the component, assembly, system or subsystem of interest. At the very least, a reliability block must include information as to how this item fails (i.e., the reliability model of the block). Once the blocks' properties have been defined, the blocks can then be connected in a reliability-wise manner to create a reliability block diagram for the system. The RBD represents the functioning state (i.e.. success or failure) of the system in terms of the functioning states of its components. In other words, this diagram demonstrates the effect of the success or failure of a component on the success or failure of the system. For example, if all components in a system must succeed in order for the system to succeed, the components will be arranged reliability-wise in series. If one of two components must succeed in order for the system to succeed, those two components will be arranged reliability-wise in parallel. (See RBDs and diagramming methods.)
In BlockSim, diagrams (including both RBDs and fault trees) can be configured as either analytical diagrams or simulation diagrams.
Analytical Diagrams
The analytical approach involves the determination of a mathematical expression that describes the reliability of the system in terms of the reliabilities of its components. (This is discussed further in the Statistical Background, RBDs and Analytical System Reliability and Time-Dependent System Reliability (Analytical) sections of the online System Analysis reference.) Analytical diagrams are appropriate when one is performing "reliability analysis." In the context of BlockSim, we use the term "reliability analysis" to refer to all analyses that do not include repairs or restorations of the component. When considering only the failure characteristics of the components, the analytical approach can be used. However, when both failure and maintenance characteristics need to be considered, the simulation method must be used to take into account the additional events.
Simulation Diagrams
In contrast to analytical diagrams, simulation diagrams can take into account repair and restoration actions, including behaviors of crews, spare part pools, throughput, etc. These actions mean that the age of system components is no longer uniform nor is the operation time of the system continuous. If one includes information on the repair and maintenance characteristics of the components and resources available in the system, other information can also be analyzed/obtained, such as system availability, throughput, spare parts utilization, life cycle costs etc. This can be accomplished through discrete event simulation.
In simulation, random failure times are generated from each component's failure distribution. These failure times are then considered in accordance with the way the components are reliability-wise arranged within the system. The overall results are analyzed in order to determine the behavior of the entire system.
Phase Diagrams
A phase diagram, or more specifically a reliability phase diagram, is an extension of the simulation RBD approach. While an RBD is used for a system with a fixed configuration throughout the entire period of operation, a phase diagram can be used to represent scenarios in which a system may undergo changes over time to one or more of the following:
- Its reliability configuration
- The available repair resources
- The failure, maintenance or throughput properties of its individual components.
For example, a manufacturing company's production may be lower during the night shift than during the day shift. Or a system may use different components during different stages of operation, such as an aircraft during taxiing, takeoff, cruising and landing. In these and many other situations, a phase diagram can be configured so that the simulation will account for the differences in the system during different time periods.
In BlockSim, phase diagrams are built using phase blocks arranged chronologically to represent each sequential stage in the operation of the system. Operational phase blocks are linked to simulation RBDs that represent the reliability-wise configuration of the system during each operational phase, while maintenance phase blocks are linked to maintenance templates that describe tasks that need to be completed at some point during the system's operation.
