Report Builder
Use the Report Builder to design the reports and charts that will be available in the Reports page and the Charts page. You can save reports that are visible only to you or shared with a specific user or group. If you have the required permissions, you can also modify the built-in "Standard" reports or save new "Public" reports that are visible to all users in the entity.
To access the page, choose Options > Designers > Report Builder.
![]()
Use the Select Report drop-down lists to select a report/chart to create or modify. For example:
- To create a new report, select an existing one that is similar. Apply your changes and click Save As. You will be prompted to specify a name, description and other details. (See Saving Reports and Charts.)
- To modify a report that already exists, select that report. Apply your changes and click Save (or Save As if you want to be prompted to change the name, description or other details).
To preview the results, save the report and then choose Options > Report > Generate.
![]()
Note: Reports only contain links to records that you have permission to view based on your security settings. If another user who has different security settings runs the same report, it will yield different results. See Security Levels for more information.
Reloading Defaults and Deleting Saved Reports
For predefined report types (Standard Reports, Chart Reports,
Administrator Reports), you can click ![]() to reload
the last saved settings. If the saved settings differ from the
default for that type of report, you can also click
to reload
the last saved settings. If the saved settings differ from the
default for that type of report, you can also click ![]() to restore the application
defaults.
to restore the application
defaults.

Note: The default Standard and Chart Reports can be modified by users with the "Report Builder - Set Application Default" permission.
For reports that were created by users (My Reports, My Chart
Reports, Public Reports, Public Chart Reports, Custom SQL Statements),
you can click ![]() to reload the last saved settings
or
to reload the last saved settings
or ![]() to delete the report.
to delete the report.

Filter Criteria and Fields to Display
The table contains a row for each field that will be displayed in the results and/or used as a filter.
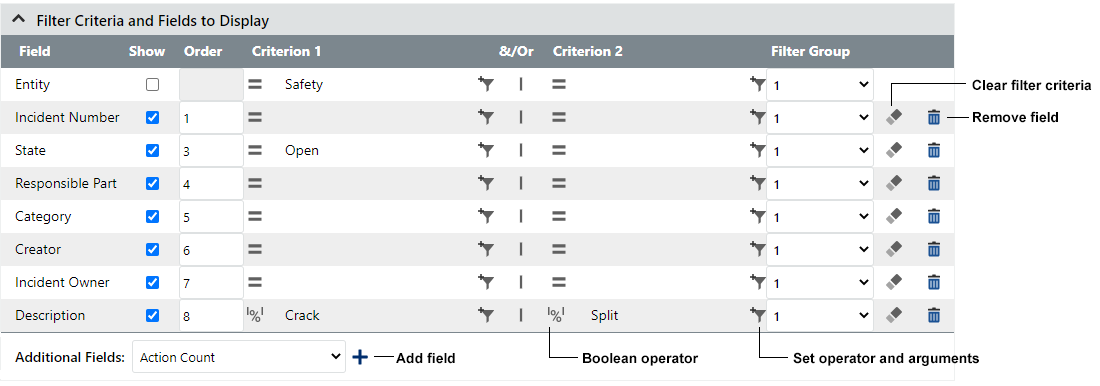
- To add a field, choose it from the Additional
Fields drop-down list and click Add
Field
 .
.
Note: The maximum number of columns that a report can include is determined by an application admin.
- To remove a field, click the Remove
Field icon,
 ,
in that row.
,
in that row. - When building a report, use the check box in the Show column to show or hide the field in the results. If the field is shown, enter a value in the Order column to specify the location of the column in the results. Numbers that are skipped are ignored.
- In the Criterion
columns, click Add Filter
Criteria,
 ,
to specify the operator and argument(s) for each field. (Alternatively,
you can click the operator icon on the left to open the same
window.) If more than one criterion is specified for the same
field, click inside the &/Or
column to toggle between AND (
,
to specify the operator and argument(s) for each field. (Alternatively,
you can click the operator icon on the left to open the same
window.) If more than one criterion is specified for the same
field, click inside the &/Or
column to toggle between AND ( ) and OR
(
) and OR
( ). To clear all filter criteria for a
field, click Clear Values,
). To clear all filter criteria for a
field, click Clear Values,  .
. - To apply the criteria in groups (e.g., results can match criteria 1 and 2 OR criteria 3 and 4), use the Filter Group column to define the groups, and then use the Filter Groups Criteria section to define the operator that will be applied between groups. (See the recommendations under "Filter Criteria Groups" below).
These are based on standard SQL operators and commands. Note that not all operators apply to all data types.
| Operator | Filters by fields that… | |
|---|---|---|
|
|
Equals | Are an exact match to the specified value |
|
|
Greater than | Are greater than (but not equal to) the specified value |
|
|
Contains | Match the specified value (word or phrase), which may be preceded and/or followed by other values |
|
|
Does not contain | Do not a match the specified value, which may be preceded and/or followed by other values |
|
|
Begins with | Begin with the specified value |
|
|
Ends with | End with the specified value |
|
|
Greater than or equal to | Are greater than or equal to the specified value |
|
|
Less than | Are less than (but not equal to) the specified value |
|
|
Less than or equal to | Are less than or equal to the specified value |
|
|
Not equal to | Are not an exact match to the specified value |
|
|
Empty | Do not contain a value (i.e., are null) |
|
|
Not empty | Contain a value (i.e., are not null) |
|
|
IN | Match any of multiple specified values (shorthand for multiple OR conditions, frequently used for lists) |
|
|
Not IN | Do not match any of multiple specified values |
Creating Date Filters
If you are building a report or chart and using date fields, you can define filter criteria based on the current day, a specific date, or a standard period — week, month, quarter or year (this or next). In addition, you can define filter criteria based on a specified number of days in the past or future with records for the current day included, if desired.
In the Report Builder’s Filter pop-up window:
- Choose the Number of Days option from the Specify Date drop-down list.
- Choose Last or Next from the new drop-down list that appears and enter the number of days.
- If applicable, enable the Include today check box.
Note: New in Version 2021, if history logging is enabled for your XFRACAS implementation, you can use the Historical Reporting Date field to generate a report that shows a historical “snapshot” of your data at a specified point in time. (See Viewing Historical Data for more information.)
Part Details and Serialized Details
When applicable, report results can include information about the particular template part or serialized system that each incident or problem pertains to:
- For incidents, the report can include fields from the System/Component Information Area as well as any configurable fields for the template part or serialized system.
- For problems, the report can include the "Part Category" as well as any configurable fields for the specified part.
In the Report Builder's Additional Fields list, these fields are identified with the prefix "Part Detail" (for template parts) or "Serialized Detail" (for serialized systems).
Print Preview Links
A Print Preview field is a link to a customized presentation of the data for a particular record. If an administrator has configured this type of field in the page for a given record type, you can include those links in your report. The report results will show the same link that is displayed in the record. Since every record will have the same link, the criterion columns will not be available for this type of field.
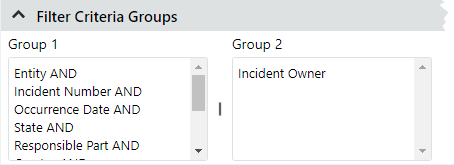
Filter Criteria Groups
If you have specified more than one Filter
Group in the table, you can toggle between AND (![]() ) and OR (
) and OR (![]() ) to specify the operator
that will be applied between groups.
) to specify the operator
that will be applied between groups.
In the following example, the results will include records that match all of the criteria in the first group (AND operators for all fields in Group 1) or the single criterion in the second group (OR operator between Groups 1 and 2).
Sorting
When you are building a report, this area specifies how the results will be sorted when they are generated. The results will be sorted by each field in the Selected list, successively.
Select a field and click ![]() or
or![]() to move it from one list to the other. Double-click
a field in the Selected list to toggle between ascending (ASC)
and descending (DESC) order.
to move it from one list to the other. Double-click
a field in the Selected list to toggle between ascending (ASC)
and descending (DESC) order.
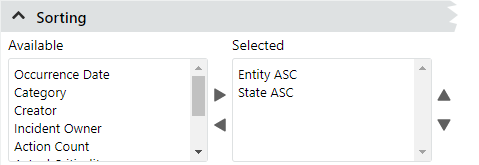
Users can also change the sort order after the report is generated. (See Reports.)
Output
When you are building a report, you can choose whether the results will be displayed in HTML, XML or XSLT.
- HTML Table - If you choose this default, the results will be displayed in a tabular format and you can specify the number of records shown per page.
- XSLT - If you
choose XSLT, you can either specify an *.xslt style sheet (Extensible Stylesheet Language
Transformation) or leave the XSLT File field blank.
- If you specify an *.xslt style sheet, it will be used to customize the presentation of your results. (See Working with XSLT Files.)
- If you do not specify a style sheet, the XSLT option will generate XML data for external use in your own custom XSLT output, in a custom application or in a tool such as Power BI or Excel. (See Using Reports as Web Data Sources.) This feature allows you to extend the reporting capabilities of XFRACAS.
Related Topics and Links
- Viewing Historical Data
- Saving Reports and Charts
- Chart Control and Appearance
- Reports
- Charts
- Using Reports as Web Data Sources
- Security Levels