Configuring a Drill Down
Drill down can be enabled for the following dashboard items:
- Grids: Specify two or more columns
- Charts and pies: Specify two or more arguments and/or series
- Gauges: Specify two or more series
- Cards: Specify two or more series
Configuring a Drill Down Sequence
- In the Dashboard Layout Designer window, select the chart or grid you want to drill down.
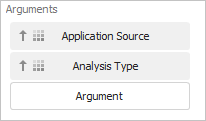
- Drag the additional data fields into the Arguments area in the appropriate order for the desired drill down sequence.
For example, you can use the following sequence to configure a pie chart in a Analysis Explorer dashboard to first show analyses by application source, then drill down to analysis type.

- Choose Data > Filtering > Drill Down. This command is a toggle; choose the command again to disable the drill down.
When any user views this layout in the Dashboard
Viewer, he/she will be able to double-click inside the chart
to drill down, and use the arrow (![]() ) to drill
back up. (See Viewing
Drill Downs.)
) to drill
back up. (See Viewing
Drill Downs.)
Tip: To make it easy to identify a drill down in the Dashboard Viewer, display the dashboard item's caption bar (Design > Common > Show Caption).