DVP&R Worksheet
The Worksheet tab displays the test plans (blue fields) and reports (green fields) that will be tracked with the DVP&R. If you have the permissions necessary to edit the project properties, you can choose which fields will be enabled and what they will be called. This includes user-defined fields and the ability to define the options in the user-defined drop-down menus, when applicable. The following image shows the relationship of the plan and report records in the DVP&R.
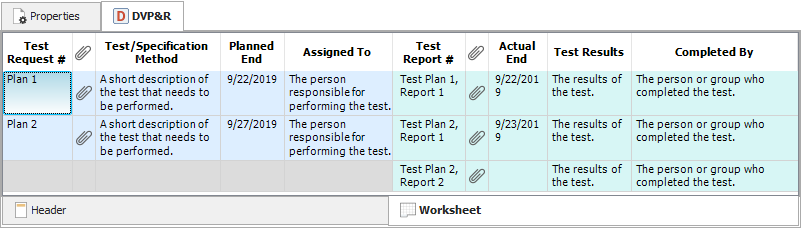
Example of the data-entry columns that you could enable or configure in a DVP&R
When using the DVP&R worksheet, you have the following options:
-
To enter or edit data, double-click the cell.
- For text columns, you can use the HOME, END and arrow keys to move through the text in the cell. For date columns, you can click the column once to open a calendar or twice to type the date. You must use the mm/dd/yy or mm/dd/yyyy format.
- To save the changes, either press ENTER or TAB or click somewhere outside of the cell.
-
The following options apply to plans and reports. While the examples given are for plans, the commands are similar for each record type:
- To add a plan, choose DVP&R > Plan > Add Plan.
- To insert a plan above the currently selected one, choose DVP&R > Plan > Insert Plan.
- To copy, select the plan in the worksheet area and choose Home > Clipboard > Copy. To paste a copied plan, choose Home > Clipboard > Paste.
- To move a record up or down one place in the list of plans, select the plan in the worksheet area, then right-click the worksheet and choose Up or Down from the shortcut menu or choose Home > Move Record > Up or Home > Move Record > Down.
- To delete, select the plan in the worksheet area and either choose Home > Edit > Delete or press DELETE.
- To transfer data from the associated FMEA to the DVP&R, choose DVP&R > Sync > Sync with FMEA.
- To import data from an Excel spreadsheet, choose System Hierarchy > Add Items > Import > Import from Excel. To export data from the DVP&R worksheet to an Excel spreadsheet, choose System Hierarchy > Tools > Reporting > Export to Excel.
- To generate a report of the DVP&R data, choose Home > Reporting > Reports. In the Reports window, the DVP&R reports are located in the DVP&R Spreadsheet and DVP&R Records sections of the Available Reports area.
- To split the worksheet view so that you can view text at one side of the worksheet without moving the text at the other side, right-click a column heading and choose Split. A split bar will be placed to the left of the column. To remove the bar, right-click any column heading and choose Remove Split. (For example, you use this to see the test request number while working on the reports.)
- To rearrange the order in which the columns are displayed, select a column heading and drag it to the place in the worksheet area you want it to appear. This updates the interface style for the project. You also can change the column order through the Interface Style window.
- To change the descriptive information about each column that displays in tooltip form when you move the pointer over the column headings, open the Project Interface Style window and change the text in the appropriate DVP&R pages.
- To populate the gray areas in the worksheet with the relevant text from a prior row, choose File > Application Setup. On the Settings page select the Repeat data in worksheet views check box.