FMEA Background
Failure Mode and Effects Analysis (FMEA) is a methodology designed to:
- Identify and fully understand potential failure modes for a product or process.
- Assess the risk associated with those failure modes and prioritize issues for corrective action.
- Identify and carry out corrective actions to address the most serious concerns.
This topic provides a brief, general overview of common principles and applications for Failure Mode and Effects Analysis (FMEA) and related analyses, such as Criticality Analysis (FMECA), design verification plans (DVP&Rs), process flow diagrams (PFDs), process control plans (PCPs) and design reviews based on failure mode (DRBFM).
FMEA Applications and Benefits
Usually, the primary objective of an FMEA is to identify and mitigate risks in a product or process in order to improve the design. In addition, since the FMEA provides a central location for reliability-related information for the product or process, it can be used as a learning tool for new engineers, a resource when considering modifications to the design or developing a similar design, a resource for service personnel to identify possible corrective actions when problems occur in the field, and so on.
FMEA is often performed in conjunction with Design for Reliability (DFR), Design for Six Sigma (DFSS), ISO quality programs and other initiatives. It also may be performed to satisfy a customer or regulatory requirement.
When performed effectively, an FMEA can contribute to improved designs for products and processes, resulting in higher reliability, better quality, increased safety, enhanced customer satisfaction and reduced costs.
When to Perform an FMEA
Many references cite three situations in which an FMEA commonly may be performed:
- Creating a new design or process
- Modifying an existing design or process
- Using an existing design or process in a new environment
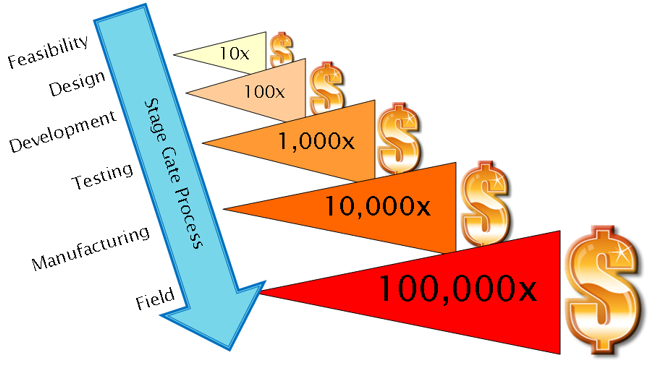
The FMEA should be performed during the "window of opportunity" when it can most effectively impact the product or process design. In general, it should be an "up-front" activity, rather than "after-the-fact." Citing the "factor of 10 rule," most practitioners agree that it is more cost effective to correct reliability issues early in the process.
Basic Analysis Procedure for FMEA
This section introduces the basic analysis procedure for FMEAs. Of course, the specific implementation approach will vary among different organizations, practitioners and applications.
Determining the Scope
Before you can begin the FMEA, you must decide what you are going to analyze. Determining the scope of the analysis is an extremely important step because it helps to identify which FMEA(s) will be performed and then, for each particular FMEA, the boundaries for what issues will be considered and the approach that the analysts will take during the analysis. The determination of the scope may be based on a variety of factors, including (but probably not limited to) timing, complexity and characteristics of the design, risk/importance, available budget, customer requirements, etc. The tools available for determining the scope will vary depending on whether you are performing a Design FMEA or a process FMEA.
If you are performing a Design FMEA, you may wish to start by defining the system configuration. Early in the design process, you may wish to perform a high-level FMEA on the entire system. As the design matures, it will be possible to perform more detailed FMEAs on individual assemblies or components. A change point analysis or preliminary risk assessment may help to focus the analysis effort on the aspects of the design that have the greatest risk and/or have the greatest potential benefit from design improvements. Factors may include:
- New technology or new application of existing technology
- Potential for safety or regulatory issues
- History of significant field problems
- Mission-critical applications
- Supplier capability
- Etc.
Tip: There are many different ways that the preliminary risk assessment can be performed. The Risk Discovery Analysis feature supports two possible methods: one based on a series of yes/no questions and another based on rating scales.
For each individual FMEA that you will perform, it may also be useful to define what components and interactions will be included in the analysis. A boundary diagram (or block diagram) shows the physical and logical relationships between the components in the system or assembly. It can identify relationships and dependencies between components as well as critical inputs and outputs.
Tip: You can use the Attachments feature to provide easy access to boundary/block diagrams that have been created with other software tools (such as Visio or PowerPoint). Alternatively, you can use the FMEA Block Diagram feature to create the diagram and link it to the rest of the analysis.
If you are performing a Process FMEA, you may start by identifying the steps in the process and the operations that must be performed at each step. In most cases, the scope of the PFMEA will be the entire process. However, in some situations, the organization may choose to exclude low-risk portions of the process.
The process flow diagram (PFD) provides a logical, visual depiction of the process that is being analyzed. The diagram typically uses specific symbols to describe different types of activities (e.g., operation, decision, inspection, storage, etc.). It also may include an identification of the product or process characteristics that need to be monitored at each step (e.g., temperature of the oven, thickness of the wax, diameter of the hole, etc.) and the possible sources of variation (e.g., incorrect setup, contamination, machine maintenance, etc.). Such diagrams can be useful to determine the steps in the process that will be analyzed in the PFMEA and to determine the functions and critical characteristics that will be considered in the analysis.
Tip: You can use the Attachments feature to provide easy access to process flow diagrams that have been created with other software tools (such as Excel, Visio or PowerPoint). Alternatively, you can use the process flow diagram feature to create the diagram and link it to the rest of the analysis.
Assemble the Team
One of the first steps in performing an FMEA is to assemble a cross-functional team of knowledgeable individuals to perform the analysis. The team should be large enough to make sure that relevant viewpoints and knowledge are represented but not too large. If the team is too large, it will be difficult to have productive discussions during meetings and it will be a waste of an extremely valuable resource – the time and patience of your organization’s subject matter experts. Team members should be familiar with the FMEA analysis process, as it is practiced by the organization. In addition, a skilled facilitator can help to make sure that team meeting time is used effectively and the analysis is performed correctly.
The composition of the team at any particular meeting may vary depending on the focus of the discussion. This may include representatives from Design, Analysis/Testing, Materials, Suppliers/OEM, Manufacturing/Assembly, Quality/Reliability, System Integration, Field Service, Maintenance, etc.
Tip: You can use the analysis plan feature to document the members of the analysis team for each FMEA.
Establish the Ground Rules and Assumptions
Before beginning the analysis, the team should discuss (and probably document) the underlying assumptions of the analysis and specific ground rules for how the analysis will be performed. Some of these guidelines may be determined already by the organization’s standard practices for FMEA and some may be specific to the particular analysis project. Some of the questions that might be considered include (but are not limited to) the following:
- What will be considered a failure?
- What are the assumed environmental and operating conditions?
- Will the analysis consider failures that result from abuse?
- What is the budget and timescale for the project and what are the project deliverables?
- What other activities within the organization will the team need to interact with and have the necessary communications been established?
- When and where will the team meet?
- Will there be a facilitator?
- How will decisions be made within the team and how will conflicts be resolved?
- What will be the format of the analysis worksheet and what rating scales will be used?
- How will the organization track the completion of recommended actions?
- And so on...
This list is provided as an example. Other issues may be applicable for your particular situation.
Tip: You can use the analysis plan feature to document the ground rules and assumptions for each FMEA.
Gather and Review Information (Pre-Work)
Taking the time to gather and review available information before the analysis meetings begin can help to make the most efficient use of team meeting time and achieve an analysis that is thorough and accurate. The appropriate resources will vary depending on the type of FMEA that you are performing and the specific product or process that you are analyzing. This may include:
- Bill of materials and/or process flow diagrams
- Customer requirements, business requirements, functional specs, technical specs
- Design schematics, drawings
- Feasibility studies or trade-off analyses
- Information from similar designs, including field data, FMEAs, etc.
- Documentation or contracts from suppliers
- Applicable government or safety regulations
This is an incomplete list that is provided as an example. Other resources may be applicable for your particular situation.
Tip: You can use the Attachments feature to provide easy access to supporting documentation that may be relevant to a particular analysis.
Identify the Functions, Failure Modes, Effects, Causes and Controls
For each item or step that will be analyzed, the analysis team will use engineering and business judgment to identify the functions, failure modes, effects, causes and controls that will be considered in the analysis.
- Function: An intended function or purpose, as described by a required standard of performance.
- Failure Mode: The inability to perform a function within the specified limits.
- Effect: The anticipated consequences if the failure mode occurs.
- Cause: The specific reason for the failure. This may be found by asking "why" until the basic mechanism that brings about the failure is determined. In many cases, there are several levels of detail that could be used to describe the cause of failure. In general, it is best to choose the level at which the organization is able to control the condition and/or take corrective action.
- Current Control:
A method or action that is planned or currently in place to
reduce or eliminate the risk. In many cases, the current controls
are classified as "Prevention" or "Detection,"
where:
- Prevention Controls are intended to reduce the likelihood that the problem will occur.
- Detection Controls are intended to increase the likelihood that the problem will be detected before it reaches the end user.
Tip: In many situations, an existing document may contain information that would be useful to import directly into your FMEA analysis (such as a requirements document, a process flow diagram worksheet, an FMEA from a similar product/process or a predefined "phrase set"). The software provides numerous features to help you find and import this information. These features are described in Importing, Exporting and Data Conversion.
Evaluate Risk for Potential Failures
A typical FMEA incorporates some method to identify and evaluate the risk associated with the potential problems identified through the analysis. Risk Priority Numbers (RPNs) and criticality analysis are the most commonly used methods for this.
To use the Risk Priority Number (RPN) method, the analysis team must:
- Rate the severity of each effect of failure.
- Rate the likelihood of occurrence for each cause of failure.
- Rate the likelihood of detection for each cause of failure.
- Calculate the RPN by obtaining the product of the three ratings:
RPN = Severity x Occurrence x Detection
To use Qualitative Criticality Analysis, the analysis team must a) rate the severity of the potential effects of failure and b) rate the likelihood of occurrence of each potential failure mode. It is then possible to compare failure modes, via a Criticality Matrix, which identifies severity on the horizontal axis and occurrence on the vertical axis.
To use Quantitative Criticality Analysis, the analysis team considers the reliability/unreliability for each item at a given operating time and identifies the portion of the item's unreliability that can be attributed to each potential failure mode. For each failure mode, they also rate the probability that it will result in system failure. The team uses these factors to calculate the criticality for each potential failure and for each item.
Tip:
The software provides an extensive array of features to support
risk assessment based on RPN and related metrics. (See Risk
Priority Numbers (RPNs).)
Quantitative and qualitative criticality analysis patterned after
the concepts in MIL-STD-1629A are also supported. (See Criticality
Analysis.)
Identify and Assign Corrective Action(s)
The next step is to identify, assign and track the completion of recommended actions that will help to reduce the risk associated with potential failures. In some situations, it may be possible to take an action that will reduce the severity of the effect when the failure occurs but in most cases, the recommended actions will be designed to either reduce the likelihood that the failure will occur or to increase the likelihood that it will be detected and controlled before the problem reaches the end user. When selecting the actions to recommend, the team may consider:
- Existing controls.
- The relative importance (prioritization) of the issue.
- The cost and potential effectiveness of the corrective action.
Tip: One of the most costly mistakes among FMEA practitioners is the failure to follow up and track the completion of recommended actions. The software provides multiple features that will help to ensure that your organization implements the actions suggested by the analysis in order to achieve the benefits that come from improving the design and reducing the risk. (See Actions.)
Perform Corrective Actions and Re-evaluate Risk
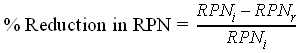
In many cases, it may be appropriate to revise the risk assessment after the recommended actions have been completed (or based on the results that the analysis team expects to achieve when they are completed). This will provide an indication of the effectiveness of corrective actions and the benefits achieved by performing the FMEA. To use revised RPNs for this purpose, the analysis team will:
- Assign revised severity, occurrence and detection ratings.
- Calculate a revised RPN.
- Compare the initial and revised RPNs.
The % reduction in RPN can be calculated with the following equation:
Distribute, Review and Update Analysis Results
FMEAs are typically reported in a tabular (worksheet) format. The style varies depending on the standard/guidelines and the terminology used during the analysis. In addition to the worksheet, other tabular reports can be useful to support decision-making and communicate the results of the analysis, such as Assigned Actions, Causes Ranked By RPN, etc. Pareto (bar), pie and matrix charts also can help to visualize analysis results.
An FMEA is most effective when it is a "living" document. When completed, the analysis should be distributed as appropriate throughout the organization so that it can be used as a resource for other activities. Your organization invested too much effort and knowledge to bury the document in the file cabinet!
Tip: You can use the Reports window and the Query Utility to create the reports to distribute the results of your FMEAs. In addition, the Plot Viewer provides a variety of charts to present the information graphically.
In general, the FMEA should be reviewed and updated:
- When there is a change to the design.
- When other factors change (such as the operating conditions or the intended application).
- When new information from the field is available.
Tip: There are several ways to manage revisions to an existing analysis, including a formal Change Log that can automatically record all revisions to an existing analysis and facilitate a process for electronic approval tracking.
After the completion of an FMEA project, it can also be a good idea to have an expert in the FMEA methodology evaluate (audit) the FMEA. In addition, you may wish to solicit feedback from the team members who participated in the analysis in order to identify issues that should be addressed in future analysis projects. A suitable checklist could be obtained from the FMEA literature or your organization may choose to develop its own audit requirements.
Tip: You can use the analysis plan feature to document the results of the quality survey for each FMEA.
Integration with Other Analyses (Including APQP)
Within the automotive industry and some other industries, practitioners have integrated FMEA with other quality planning efforts, as shown in the following diagram and described next.
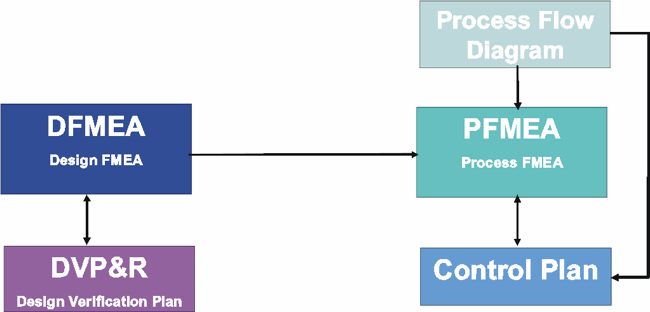
DFMEA and DVP&R
The design verification plan and report (DVP&R) is a worksheet that is used to track the progress of design verification tests. The lessons learned from the DFMEA can be a valuable input to the DVP&R (and vice-versa). For example: if the Design FMEA indicates that Part X will fail if the incorrect wax thickness is applied for protection, then it may be appropriate to add a test to the design verification plan for determining the optimum wax thickness to be applied.
Tip: The DVP&R Analysis feature provides a configurable worksheet for design verification planning and reporting, including the ability to synchronize the DVP&R with information transferred from an existing FMEA.
DFMEA to PFMEA
The lessons learned from a Design FMEA also can be a valuable input to the process FMEA. Analysts may wish to transfer relevant information between analyses, where:
- Causes in the DFMEA can become failures in the PFMEA.
- Failures in the DFMEA can become effects in the PFMEA.
For example, if the Design FMEA indicates that Part X will leak if the hole diameter is too wide then the Design FMEA will consider whether the specified hole diameter is appropriate while the process FMEA will consider aspects of the manufacturing process that may cause the hole diameter to vary from the specification.
- DFMEA: Failure = Leak; Cause = Hole too wide.
- PFMEA: Failure = Hole too wide; Effect = Leak.
- Causes = ?
- Controls = ?
- Actions = ?
Tip: The Transfer Projects feature allows you to transfer selected data from an existing Design FMEA to a new process FMEA.
Process Flow Diagram, Process FMEA and Process Control Plan
As described above, the process flow diagram (PFD) provides a logical, visual depiction of the process that is being analyzed and such diagrams can be useful to determine the steps in the process and the critical characteristics that will be analyzed in the PFMEA.
In addition, the process control plan (PCP) describes the actions that are required at each phase of the process to ensure that all process outputs will be in a state of control. The process flow diagram and the lessons learned from a process FMEA can be a valuable input to the process control plan. The linkages between these documents might be applied as follows:
- Operation # and Description flow from the Process Flow Diagram to the PFMEA to the control plan.
- Significant Product Characteristics (and Classifications) contribute to the definition of failure modes and/or causes in the PFMEA. They also flow to the control plan.
- Current Controls flow from the PFMEA to the control plan.
Tip: The PFD Worksheet feature provides integration with both the Process FMEA and the Process Control Plan worksheet.
Design Review Based on Failure Mode (DRBFM)
DRBFM is a methodology used to evaluate proposed changes to an existing design, using a worksheet that is usually similar to, but not identical to, an FMEA.
Although some organizations may choose to perform DRBFM instead of FMEA, most practitioners start with a baseline FMEA and then use the DRBFM worksheet for evaluating the risks that might be introduced by changes to the original design.
Tip: The DRBFM Analysis feature provides a configurable worksheet for design review based on failure mode, including the option to select functions that will be transferred from an existing FMEA and the ability to update the FMEA with new information from the DRBFM.
References
- Automotive Industry Action Group (AIAG), Potential Failure Mode and Effects Analysis. (February 1993, February 1995, July 2001 and June 2008).
- Automotive Industry Action Group (AIAG), Advanced Product Quality Planning and Control Plan (APQP). (June 1994 and July 2008).
- Carlson, Carl, Effective FMEAs: Achieving Safe, Reliable, and Economical Products and Processes using Failure Mode and Effects Analysis. John Wily & Sons, Hoboken, New Jersey, 2012.
- Crowe, Dana and Alec Feinberg, Design for Reliability. Ch. 12 "Failure Modes and Effects Analysis." CRC Press, Boca Raton, Florida, 2001.
- Dhillon, B.S., Design Reliability: Fundamentals and Applications, Ch. 6 "Failure Modes and Effects Analysis." CRC Press, Boca Raton, Florida, 1999.
- Kececioglu, Dimitri, Reliability Engineering Handbook Volume 2. Prentice-Hall Inc., Englewood Cliffs, New Jersey, 1991, pp. 473-506.
- McCollin, Chris, "Working Around Failure." Manufacturing Engineer, February 1999. Pages 37-40.
- McDermott, Robin E., Raymond J. Mikulak and Michael R. Beauregard, The Basics of FMEA. Productivity Inc., United States, 1996.
- Palady, Paul, Failure Modes & Effects Analysis: Author’s Edition. Practical Applications…Quality & Reliability. United States, 1998.
- Shimizu, Hirokazu and Imagawa, Toshiyuki, "Reliability Problem Prevention Method for Automotive Components: Development of the GD3 Activity and DRBFM," JSAE 20037158 SAE 2003-01-2877, 2003.
- Society of Automotive Engineers (SAE), Aerospace Recommended Practice ARP5580, "Recommended Failure Modes and Effects Analysis (FMEA) Practices for Non-Automobile Applications," June 2000.
- Society of Automotive Engineers (SAE), Surface Vehicle Recommended Practice J1739, Potential Failure Mode and Effects Analysis in Design (Design FMEA), Potential Failure Mode and Effects Analysis in Manufacturing and Assembly Processes (Process FMEA). July 1994, August 2002 and August 2008.
- Stamatis, D.H., Failure Mode and Effect Analysis: FMEA from Theory to Execution. American Society for Quality (ASQ), Milwaukee, Wisconsin, 1995.
- U.S. Department of Defense, MIL-STD-1629A, Procedures for Performing a Failure Mode Effects and Criticality Analysis. November 1974, June 1977, November 1980. (Cancelled in November, 1984).
Related Topics and Links
- FMEA Analysis
- Risk Priority Numbers
- Criticality Analysis
-
 FMEA
Corner
FMEA
Corner -
Basic Concepts of FMEA and FMECA
In This Topic
- FMEA Applications and Benefits
- When to Perform an FMEA
- Determining the Scope
- Assemble the Team
- Establish the Ground Rules and Assumptions
- Gather and Review Information (Pre-Work)
- Identify Functions, Failure Modes, Effects, Causes, Controls
- Evaluate Risk for Potential Failures
- Identify and Assign Corrective Action(s)
- Perform Corrective Actions and Re-evalute Risk
- Distribute, Review and Update Analysis Results
- Integration with Other Analyses