Usage Format
In the usage format, the analysis is based on the amount of usage the unit accumulated rather than the amount of time the unit was in the field. There are many applications where usage, not time, affects a product’s reliability. In the automotive industry, for example, the majority of failure behavior is based on mileage rather than product age. This approach could also be used in other situations, such as the number of pages for a printer, number of cycles for a washing machine, etc.
Tip: When forecasting warranty returns, you can predict the number of failures based on the time and usage as well as the time. For example, for a vehicle with a 3-year/30,000 mile warranty, you can forecast the total number of warranty returns based on both values.
Units
In the usage format, you can use any usage units (e.g., miles, cycles, etc.) appropriate for your data by clicking the Change Units icon on the Main page of the folio's control panel.
![]()
This opens the Change Units window, which gives you a selection of units to use. The units that are available in the drop-down list are defined at the database level. Note that in the usage format, selecting a new unit only changes the name of the unit; the data set is not converted to the new unit. The appropriate columns in the data sheet will be automatically configured for the units you selected, and the new unit will be displayed next to the results in the control panel.
Data Sheets
The usage format consists of three data sheets: Sales, Returns and Future Sales.
Note: For the column headings in this sheet, the general term in-service represents the closest estimate of the time at which each unit started operating in the field. For example, if you have access to both the manufacturing date and the shipping date for a group of parts, you may choose to perform the analysis based on the shipping date because it is a closer indicator of the time the product started operating in the field.
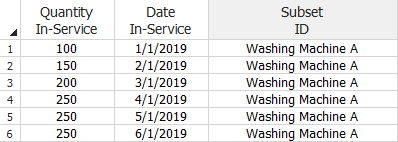
In the Sales sheet:
- The Quantity In-Service column is for entering the number of units that are assumed to have started operating during each period.
- The Date In-Service column is for entering the calendar date on which the units are assumed to have started operating.
- The Subset ID column is for logging any pertinent information or comments about the data. You can also use the Subset ID column to categorize subpopulations in your data sets. You will be able to choose a distribution appropriate for each subset of data by selecting the Use Subsets option on the Main page of the control panel.
Note: The subset ID can be any text up to 30 characters, including spaces. For example, "A _ _ X" is not the same as "A _ X" where "_ " is used to designate a space.
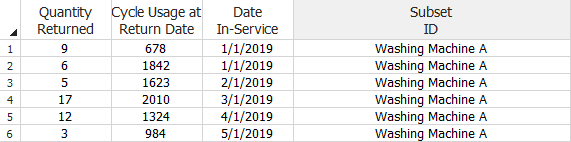
In the Returns sheet:
- The Quantity Returned column is for entering the number of units returned.
- The Usage at Return Date column indicates the amount usage the units accumulated before they were returned. In the following example, the usage unit is in terms of cycles.
- The Date-In-Service column indicates how long the units were in service before they were returned. Each entry in the Date In-Service column in the Returns sheet must have a matching entry in the Date In-Service column in the Sales sheet.
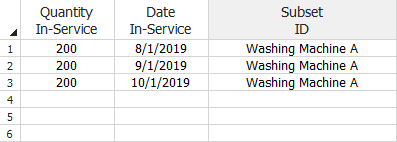
In the Future Sales sheet:
- The Quantity In-Service column is for recording the projected number of units to be sold. This information is used in the forecast analysis.
- The Date In-Service column is for logging the anticipated manufacturing/sales/shipment period.
Other Analysis Settings
- The End of Observation Period setting on the Main page of the control panel is used to convert the sales/return data to failures/suspensions. The date is typically set to the last day the warranty data was collected. It is used to determine the time in service for each unit that had not yet been returned by the end of the observation period. Click Today if you wish to set the end date to the current date, as shown next.
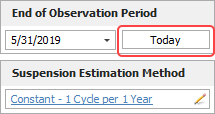
- The Suspension Estimation Method setting on the Main page of the control panel allows you to specify how Weibull++ will estimate the amount of usage for units still in the field (suspensions). See Estimating Usage.
To view or change the settings, click
the ![]() icon or click the Suspensions
page icon at the bottom of the control panel.
icon or click the Suspensions
page icon at the bottom of the control panel.
![]()