Forecasting Warranty Returns
Once the warranty data set has been converted to failure/suspension times, the information can be used to predict the number of failures, or warranty returns, in subsequent time periods. Accurate predictions about the quantity of products that will be returned under warranty can provide huge benefits to manufacturing organizations, such as the ability to anticipate customer support needs and correct serious product quality problems in the field before other problems occur.
Tip: For folios that use the usage format, you can predict the number of failures based on the time and usage as well as the time. For example, for a vehicle with a 3-year/30,000 mile warranty, you can show the total number of warranty returns based on both values.
Forecast Setup
To generate a forecast, choose Warranty > Tools > Forecast or click the icon on the control panel.
![]()
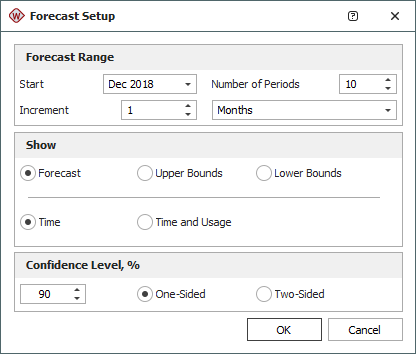
Then in the Forecast Setup window:
- Enter the Start
date for the forecast, the number of forecasts (Number
of Periods field) and the length of each forecast (Increment field). In the
example shown below, the time unit is in terms of years; therefore,
an increment of 1 would mean that 1 forecast period is equivalent
to 1 year, while an increment of 2 would mean that 1 forecast
period is equivalent to 2 years. Note that:
- In the Nevada chart format, the forecast period uses the same time units used in the data sheets.
- In the times-to-failure format, the unit of time is not defined; however, it is consistent with the unit of time used in the data sheet.
- In the dates of failure format and the usage format, you can specify the forecast period to be in days, months or years.
- Select whether you want the forecast sheet to display the Forecast (i.e., projected returns) or the Upper Bounds or Lower Bounds of the forecast.
- For a usage format folio, select whether you want to generate the returns based on the Time only or on the combined Time and Usage estimates.
- Finally, enter the desired confidence level and select whether to calculate One-Sided or Two-Sided confidence bounds.
Forecast Sheet
The example shown next is a Forecast sheet for the Nevada chart format. The column headings represent the warranty periods and the row headings represent the sales periods. Forecasts for the future sales periods are in the yellow cells.
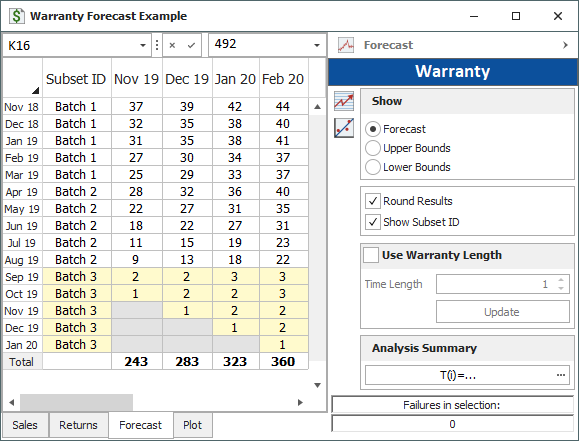
The Forecast sheet includes a control panel that contains the following settings:
- In the Show area, you can select to view the results as the Forecast, as the Upper Bounds of the forecast or as the Lower Bounds of the forecast.
- Round Results rounds the estimates to the nearest integer. Note that the column totals are calculated based on the non-rounded results.
- Show Subset ID adds a column in the Forecast sheet that displays the corresponding subset ID of the data in the Forecast sheet.
- The Use Warranty Length check box limits the length of the warranty period. By default, the software assumes an infinite warranty period. Limiting the warranty period allows you to disregard the number of returns that are outside the warranty period. For example, a warranty length of 12 months would mean that any units that fail after 12 months of operation are out of warranty, and are therefore not counted in the total number of returns. This is useful when planning for warranty costs, spare parts and other fulfillment needs that fall within a specified period.
For the usage format, if selected in the Forecast Setup window, you can also specify the maximum Usage Length value. Limiting the usage length allows you to disregard the number of returns that had more usage than the warranty allows. For example, a usage length of 30,000 miles would mean that any units that fail after having been operated for 30,000 miles are out of warranty and are therefore not counted in the total number of returns.
In the forecast sheet, the values shown include the number of failures for both time and usage.
Enter the length of the warranty period in the Time Length field and, if applicable, the Usage Length fields and click Update. These options use the same units you selected for the period increments in the Forecast Setup window and the usage units used in the Returns data sheet.