Stress Profile Example
For life-stress data only.
A reliability engineer is asked to determine, with a confidence level of 90%, whether an electronic component has a B10 life of at least 350 hours under ordinary conditions.
To simplify the analysis, the engineer will assume that the ordinary stress conditions for the component consist of a constant stress level of 2 V. However, because the ordinary stress conditions are known to involve escalating stress values, the component will be subjected to a time-dependent voltage stress during testing. The following table describes the stress values that will be applied during the test.
|
Starting Time (Hr) |
Ending Time (Hr) |
Stress Level (V) |
|
0 |
250 |
2 |
|
250 |
350 |
3 |
|
350 |
370 |
4 |
|
370 |
380 |
5 |
|
380 |
390 |
6 |
|
390 |
400 |
7 |
All eleven units were tested to failure using the same stress profile. The following failure times were observed in the test.
|
Failure Time (Hr) |
Stress Level |
|
280 |
Time-dependent |
|
310 |
Time-dependent |
|
330 |
Time-dependent |
|
352 |
Time-dependent |
|
360 |
Time-dependent |
|
366 |
Time-dependent |
|
371 |
Time-dependent |
|
374 |
Time-dependent |
|
378 |
Time-dependent |
|
381 |
Time-dependent |
|
385 |
Time-dependent |
Create a Life-Stress Data Folio and Stress Profile
- Choose Home > Insert > Life-Stress Data. Since all the data are exact failure times, clear all of the check boxes in the Options for the Times-to-Failure Data Type area. Then, select Hour (hr) from the Units drop-down list and click Next.
- On the second page of the setup window, select Voltage as the stress types. Set the use stress level to 2 with V as the unit. Click OK to close the setup window and create the new life-stress data folio.
- Enter the failure times into the data sheet.
- On the control panel of the data sheet, select CD-Weibull. Click Stress Transformation and apply the Logarithmic transformation to the stress.
- To create a stress profile:
- Click the
 icon on the control panel.
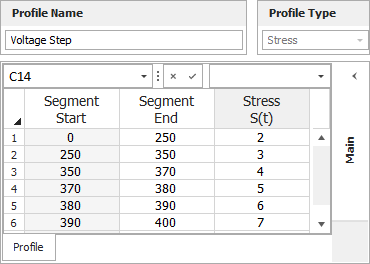
 - In the Profile window, rename the profile to "Voltage Step." Enter the segment end times and stress values into the data sheet, as shown next.
- On the control panel, select Continue with last value. Click the Validate Stress Profile icon to validate the information in your new profile. Finally, click the Plot icon to view a stress vs. time plot of the profile.
- Click OK to save the profile with the project and close the window.
- Click the
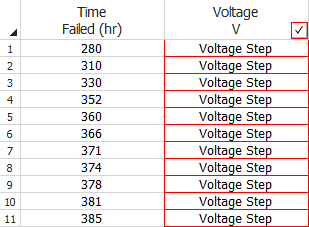
- To assign the stress profile to a failure time, double-click the corresponding cell in the Voltage column of the data sheet, then click the drop-down arrow and choose Voltage Step from the list. After you have filled out the data sheet, it should appear as shown next.
Analyze the Data Set
- Click the Calculate icon on the folio's control panel. The parameters of the model will be automatically computed and displayed in the Analysis Summary area of the control panel.
- To estimate the B10 life of the device, choose Life-Stress Data > Analysis > Quick Calculation Pad or click the icon on the control panel.
![]()
- In the QCP,
choose to calculate the BX%
Life with Lower One-Sided
confidence bounds. Select Hour
for the time units and then make the following inputs:
- Stress = 2
- BX% Life At = 10
- Confidence Level = 0.9
- Click Calculate to display the results. The results show that the component's estimated B10 life is 507.9438 hours. The lower one-sided 90% confidence bound is shown to be 300.4821 hours. Thus, the test's results do not show with 90% confidence that the component's B10 life is at least 350 hours.
