Example of a Dates of Failure Warranty Analysis
A manufacturer sold two versions of a product. In addition, a new version is planned for future release. The objective is to analyze the data for all versions and provide a return forecast for the next 20 months.
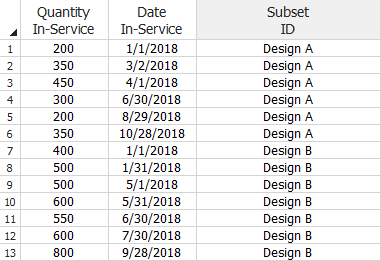
The following data sheet shows the sales data.
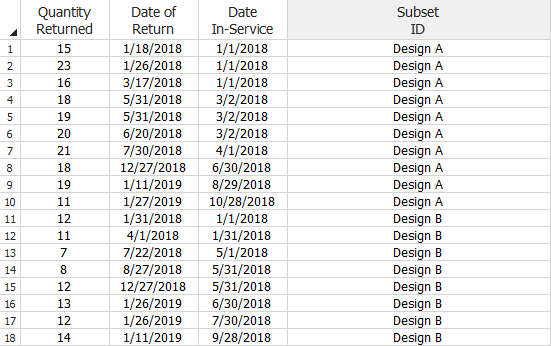
The following data sheet shows the returns data.
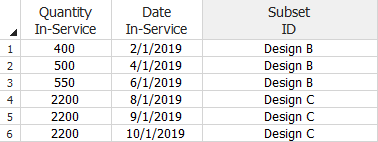
The future shipments are expected to be as follows.
Analyze the Data for Each Product Version
- The information in the Returns sheet is current as of January 31, 2019. Therefore, on the Main page of the control panel, set the End of Observation Period date to 1/31/2019 to indicate that the warranty data collection period ended on that date.
- To analyze each product, select the Use Subsets option on the Main page of the control panel. For all subset IDs, choose the Lognormal distribution and the MLE analysis method.
- Click Calculate. You will be prompted to enter the parameters of Design C. Because Design C is a future product and no returns have been experienced yet, you will need to define its failure behavior. Information from the company’s test data indicate that Design C follows a lognormal distribution with a log-mean = 11 and log-std = 2.2 days. Enter these values in the input window, as shown next.
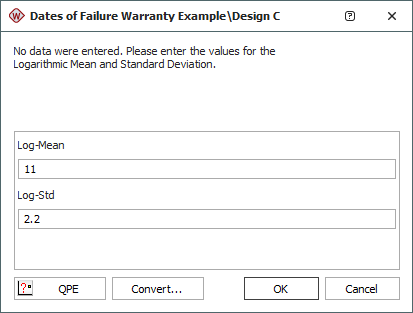
Note: Because the unit of time in the dates of failure format is in days, the parameters that are assigned to a data set must also be in terms of days.
- Click OK. The results show that for Design A, the parameters are: log-mean = 8.4394 and log-std = 2.2311; for Design B, the parameters are: log-mean = 10.0772 and log-std = 2.2973.
Generate a Warranty Forecast
The next step is to generate a warranty forecast to predict the expected number of product returns.
- Choose Warranty > Tools > Forecast or click the icon on the control panel.
![]()
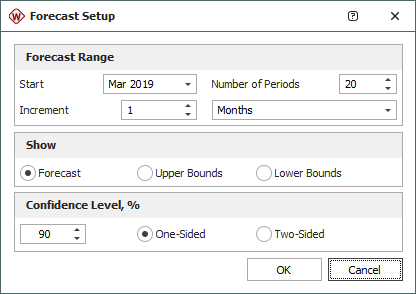
- In the Forecast Setup window, enter a Start date of 3/1/2019 and obtain forecasts for 20 periods, as shown next. Set the increment to once per month, and then click OK.
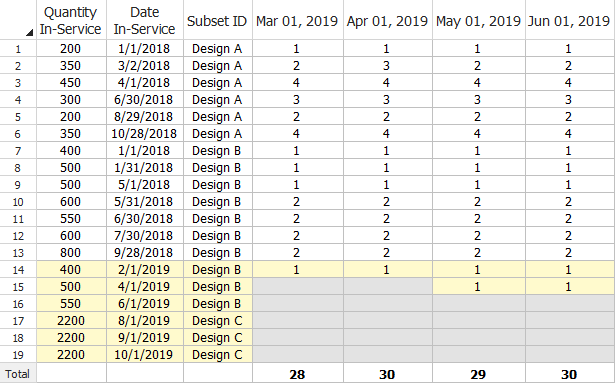
- On the control panel of the Forecast sheet, select the Show Subset ID check box. The following figure shows the Forecast sheet with the first 4 months of expected product returns. The first row of the Forecast sheet tells us that 200 units of Design A were sold on 1/1/2018 and that 1 of those sold units is expected to fail between February 1, 2018 (the day after the End of Observation Period date) and March 1, 2018.
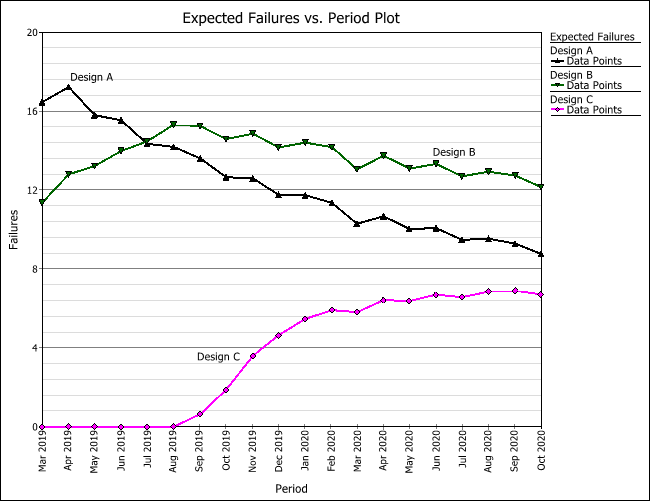
- On the control panel of the Forecast sheet, click the Plot icon. In the Plot Type field, choose Expected Failures. The following plot shows the total number of expected failures from each design version over the next 20 months. This forecast analysis can help the manufacturer predict the failure behavior of each product version in the field, as well as plan for the warranty costs and service for each product version.