RDT Table and Plot
For reliability growth data analysis only.
In addition to calculating a single value (i.e., required test time per system or number of systems to test), the repairable systems test design folio also allows you to create a table and plot that provide quick ways to consider many possible test plan scenarios without having to perform each calculation individually. Depending on what you select to solve for, the table will display a range of test duration values as a function of sample size and number of allowable failures, or it will display a range of required sample size values as a function of test time and number of allowable failures. The plot will graphically display the results with one line for each number of allowable failures.
Note: If you want to create an RDT table for a reliability demonstration test, refer to RDT Table: Parametric Binomial Table and Plot.
Follow the steps outlined below to create the table.
- Open the repairable systems test design folio and solve for required test time or number of systems.
- Click the Show RDT Table icon on the control panel.
![]()
- The Table of RDT sheet will appear. In the Calculation
Options area, select which value you wish to have the
table solve for.
- Test time given number of systems solves for the test time given different numbers of systems that could be tested. When you select this option, the Number of Systems Range area will require that you enter the smallest and largest integer that you want to consider, along with an increment to determine how many values in between will also be calculated. For example, if you specify 10 to 20 with a increment of 2, the table will show results for 10, 12, 14, etc.
- Number of systems given test time solves for the number of systems that must be tested given a different test times. When you select this option, the Test Time Range area will require that you enter a starting test time, an ending test time and an increment value by which the test time will increase.
For either option, you must enter starting, ending and increment values for the number of allowable failures in the Number of Failures Range area. A demonstration test will fail to demonstrate the target metric if the number of failures exceeds this number. Thus, if you are designing a zero-failure test, then the test will demonstrate the target metric only if no failures occur.
- Click Generate Table to create the table.
![]()
An example table is shown next.
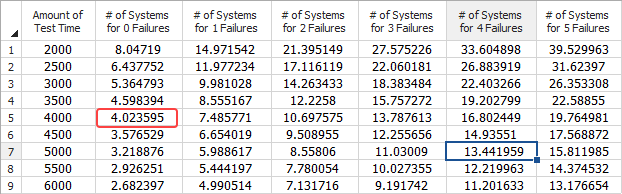
You can use this table (and the plot of the results shown below) to consider different test scenarios. For example, according to the fifth cell in the column called "# of Systems for 0 Failures," if you tested 5 systems (i.e., 4.0236 rounded up to the nearest whole number) for 4,000 hours each and no failures occurred, then the test would demonstrate the target metric.
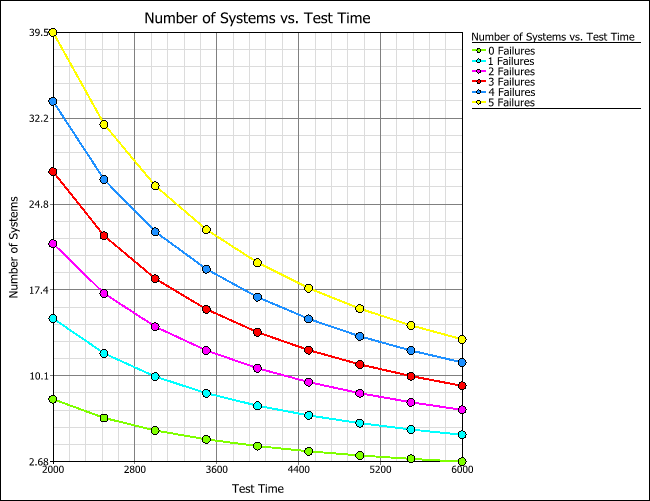
- To view a plot of the table results, click the Plot icon.
![]()
Each colored line in the plot corresponds to a specific number of failures; this depicts how the allowed number of failures influences the test time and the required sample size. To choose which lines to display in the plot, use the options in the Select Failures area on the control panel. In the following plot, lines for all numbers of allowable failures considered in the table (i.e., 0 to 5) are shown.