Repairable Systems Test Design Folio Example
For reliability growth data analysis only.
This topic presents an example of how to use the repairable systems test design folio to calculate the number of repairable systems needed to show a specified MTBF at a specified confidence level in a zero-failure demonstration test. An RDT table and plot will also be created in order to examine a variety of different test scenarios.
At the end of a reliability growth testing program for a repairable system, a manufacturer wants to demonstrate that a new product has achieved an MTBF of 10,000 hours with 80% confidence. The available time for the demonstration test is 4,000 hours for each system under test. Assuming zero failures are allowed, determine the required number of systems to be tested in order to demonstrate the desired MTBF.
Follow the steps outlined next to solve for the required number of systems.
- Create a new test design folio by choosing Home > Insert > Repairable Systems Test Design.
![]()
- On the control panel, specify that time values will be in hours, and select to round up the number of systems to the next whole number (e.g., any number above 4 will be displayed as 5), as shown next.
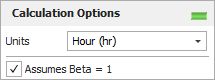
- On the input sheet, specify that you wish to demonstrate an MTBF of 10,000 hours with a confidence level of 80%, as shown next.
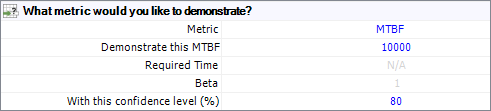
- Then specify that you wish to use the folio to solve for the Required number of systems that must be tested to demonstrate this value, given an available test time of 4,000 hours and with 0 failures allowed, as shown next.
- After you select the Display systems as integers option on the control panel, click the Calculate icon to view the result.

According to the folio, if you test 5 systems for 4,000 hours and no failures occur, then you will demonstrate an MTBF of at least 10,000 hours with 80% confidence.
- You can use the RDT table to compare the required test times given different numbers of systems and different numbers of allowable failures. To generate an RDT table using these inputs, click the Show RDT Table icon.
![]()
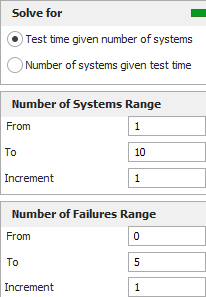
- Use the default settings on the control panel of the Table of RDT sheet. According to these settings, the table will calculate the test time required to demonstrate the target metric. The tool will consider different numbers of systems that could be tested, from 1 to 10 in increments of 1. And the number of allowable failures will range from 0 to 5, also in increments of one.
- Click the Generate Table icon to recreate the table.
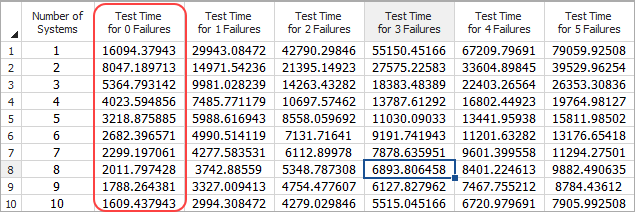
![]()
The table appears next. For example, by looking in the second column, you can investigate the test times required in a zero-failure demonstration test, given different numbers of systems being tested.
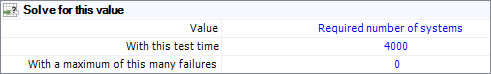
- To show the table's results in a plot, click the Plot icon.
![]()
Like the RDT table, the plot shows the relationship between number of systems and test time, given different numbers of allowable failures. To choose which lines to display in the plot, use the options in the Select Failures area on the control panel. In the following plot, lines for all numbers of allowable failures considered in the table (i.e., 0 to 5) are shown.