Associated Data Sources
In ReliaSoft Workbooks in Weibull++ and BlockSim, you have the option to associate multiple data sources that can be used for any function that obtains data or results from an existing analysis. (To obtain results from a DOE analysis in Weibull++, see DOE Analysis Report.)
When you create this type of function, you will have the option to use an index to specify which of the currently assigned default data sources will be used. For example, if you want to compare the reliability values calculated from two different analyses, you can use =RELIABILITY(Default1,1000) to get the result from the first default data source, and =RELIABILITY(Default2,1000) to get the result from the second default data source.
Although you will be prompted to associate the first data source when you create the report, you can add or change associated data sources for an existing report at any time.
Associating Data Sources
For ReliaSoft Workbooks, the Information panel (located on the right side of the window) shows which analyses are currently assigned as default data sources. To have the panel always display, click the pushpin icon into the vertical position.
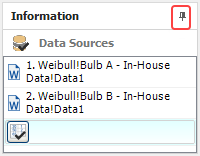
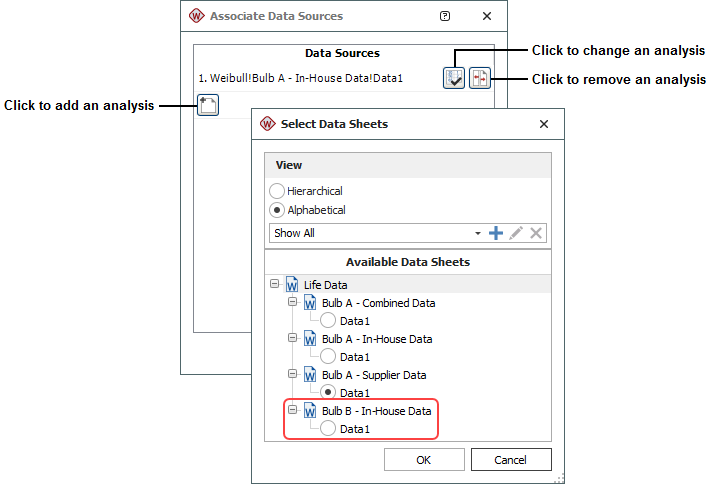
To add or remove analyses, choose Home > Report > Associate Data Sources or click the icon in the Information panel.
![]()
The following picture shows the windows for Weibull++. Similar functionality is available in BlockSim.
Note that:
- In Weibull++
you can select any data sheet from a folio that contains a
life data analysis or a growth data analysis:
- Life data folio
- Life-stress data folio
- Non-parametric LDA folio
- Warranty analysis folio
- Degradation analysis folios (the results shown in the report will be based on the analysis of the extrapolated failure/suspension times)
- Growth data folio
- In BlockSim, you can select any analytical diagram, simulation diagram or phase diagram. The function results can either be based directly on the analyzed/simulated diagram, or based on a model that has been fitted to the diagram. You specify this preference on the diagram’s control panel, using the Report folio model drop-down list on the Analysis Settings page.
Linking Multiple Data Sources with Different Time Units
In BlockSim, function results that are time-based (e.g., downtime, time to event, etc.) will be returned in terms of the System Base Unit (SBU) for the database. However, in Weibull++, each function result is returned in the units used by its data source. If you wish to compare the results from multiple data sources that use different time units, there are two possible scenarios:
- Convert the data in the original data source. For example, if one data set is in "hours" and another is in "days," you could use the Change Units feature to automatically convert the data in the first analysis from "hours" to "days."
Tip: If you want to keep the original analysis unchanged, you could create a copy of the data sheet, then convert the duplicate data sheet to use the new units.
- Manually adjust the functions so they return results in the same units. For example, if the data set is in "days" and you want the results to display the B10 life in "hours," you could adjust the function by adding a conversion ratio. For example, if 1 day is equivalent to 24 hours, you could edit the function as follows: =(TIMEATPF(Weibull!Week!Data1,0.1))*(24).