Time-Dependent Stress Profiles
For life-stress data only.
Stress levels under test conditions and/or during normal use may vary with time. For example, an engineer may decide that each unit in a sample will be tested at 310 K for the first 10 hours of a test, 320 K for the next 10 hours, and 330 K for the remainder of the test.
You can create profiles, which are resources that allow you to represent how stress levels will vary with time. Profiles are designed to be used with the cumulative damage model, which is available only in Accelerated Life Testing PRO. When you select a cumulative damage model in the life-stress data folio, all of the profiles validated in your project become available to describe use level stress conditions and stress conditions during testing.
Note: If you are an Accelerated Life Testing Standard user who needs to use time-dependent stress profiles in your analysis, please contact ReliaSoft for information about upgrading to Accelerated Life Testing PRO.
Stress Profiles in the Life-Stress Data Folio
There are two ways you can use profiles in a life-stress data folio. Note that:
Because stress and time units are not defined in a profile, it is important to apply profiles only to folios that are intended to use the same stress and time units.
If you update a profile that is associated with a life-stress data folio, the calculations in the folio will not be updated automatically. To update the calculations, click the Calculate icon on the folio's control panel.
Use Profiles to Describe Stress Conditions
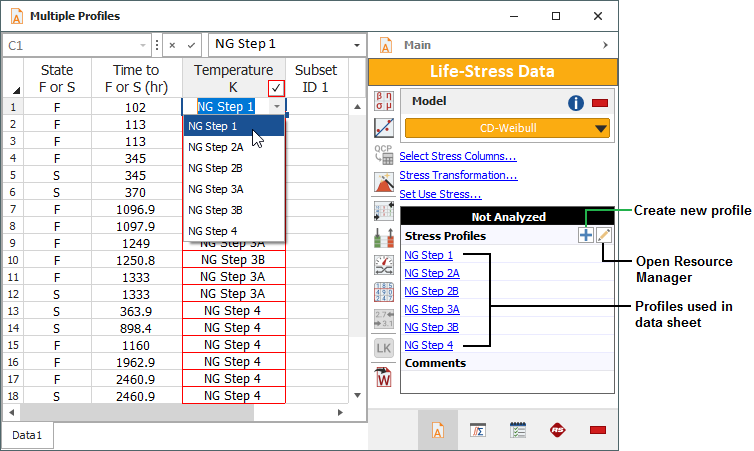
Select the cumulative damage life-stress model on the folio's control panel. To assign a stress profile to a data point, double-click a cell in the stress column, then open the drop-down list to see all validated stress profiles in the current project. The control panel will show a list of stress profiles used in the data sheet.

Use Profiles to Describe the Use Stress Condition
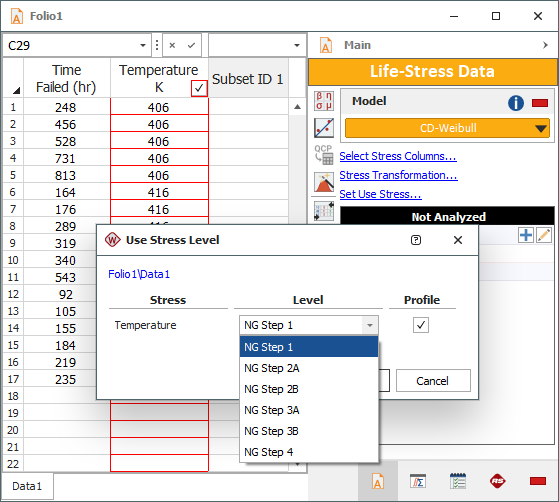
Select the cumulative damage life-stress model on the control panel, then click the Set Use Stress link. In the Use Stress Level window, select the Profile check box for all applicable stresses. A drop-down list containing all the validated stress profiles in the project appears. Note that when you use a stress profile in this way, some plots (e.g., the use level probability plot) will not be available.
