Tile Settings
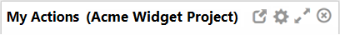
Each tile features a title bar that includes a set of icons:
- The Settings
icon,
 , opens a dialog box where you can
configure the settings that apply to the tile.
, opens a dialog box where you can
configure the settings that apply to the tile. - The Maximize
icon,
 , opens
a popup window that contains an enlarged version of the tile.
, opens
a popup window that contains an enlarged version of the tile. - The Delete icon,
 , removes a tile from the dashboard.
 - The Open Page
icon,
 , is available
for many types of tiles (e.g., My Actions and Recent Messages).
Click this icon to open related SEP pages (e.g., My Actions
and Messages).
, is available
for many types of tiles (e.g., My Actions and Recent Messages).
Click this icon to open related SEP pages (e.g., My Actions
and Messages).
The title bar also shows the tile's title (e.g., "My Actions"), which you can configure using the Settings dialog box.
Data Sources
Depending on its type, a tile may display:
- Data that's relevant to you and independent of any project (e.g., Recent Messages, My Projects).
- Data that originates from one or more specified desktop projects or XFRACAS entities.
Tip: My Projects includes all of the projects you have currently selected. (See Projects in SEP.)
For the following cases, the data source(s) will appear in parentheses in the tile's title bar:
- If the tile has a single data source (project or entity), it shows the name of this source.
- If the tile has multiple data sources that you have selected, it displays the number of sources (e.g., "3 projects").
Tip: To see a list of these sources, toggle a popup box by moving your cursor over the title bar.
- If the tile includes data from multiple sources that are relevant only to you, it displays "All projects," "All my entities," "My metrics," etc.
The title bar does not include a data source if it is not applicable for the tile type (e.g., Recent Messages, My Reports, My Projects).
Active and Selected Projects
Many tiles give you the option to display data for “active” or “selected” projects.
The active project is the one that is currently selected on the Project Summary, Project Plan (if enabled) and FMEAs pages. Use the Change Project button on one of these pages to activate a project (see Projects in SEP). You can also "activate" a project by clicking its link in the My Projects tile, if this tile is included in your dashboard (see Projects Tiles).
To display data for selected projects:
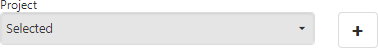
- Open the Settings dialog box and choose the Selected option from the Project drop-down list.
- Click the Add button to display a list of projects that you have permission to view.
- Select the desired project(s) and click OK.
To find projects more easily, you can use the search tool or apply any project filters that you have created in the desktop applications (see Project and Item Filters).
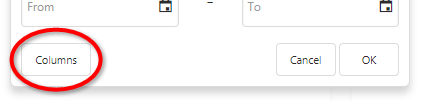
Grid Tile Columns
Use the Columns button to add or remove columns from grid tiles.
See Working with Grid Tile Columns to learn how to move, resize, sort, filter and group columns.
Selecting a Date Range
Some tiles allow you to display data for a specified date range. For these tiles, the Settings dialog box provides options for selecting "custom" and "preset" date ranges.
Custom Date Ranges
The Custom option allows you to use the calendar tool to select start (From) and end (To) dates. Alternatively, you can type dates into these fields in the month/day/year format — e.g., 1/2/2019.

This option will display the data that's available for all dates within the selected range, including the start and end dates.
Preset Date Ranges
The Preset option allows you to display data for a specified number of past (Last) or future (Next) “calendar” periods — days, weeks, months, quarters and years. You can also select to display data for the current (This) calendar period.
- Weeks start on Sunday.
- Months start on the first and end on the last day — e.g., May 1–31.
- Quarters run from January 1 – March 31, April 1 – June 30, July 1 – September 30 and October 1 – December 31.
- Years cover the period from January 1 through December 31. For the number of periods, you must specify an integer ranging from 1 to 10000.

This displays data that is available for the current calendar period. For example, if today’s date is February 14:
- Selecting This and Month will show results for February; in this case, the results will cover the period from February 1–14 and include the current day.
- Selecting This and Year will show results for January and part of February. Note that selecting This automatically forces the number field to 1.
Last allows you to specify a past time interval. Choose the Last + Current option to include the current day, week, month, etc., in your results. For example, if today’s date is February 14:
- Selecting Last 2 Months will return results for the previous December and January.
- Selecting Last + Current 2 Months will return results for January and February.
- Selecting Last 3 Weeks will return results for the last full 3 weeks preceding the 14th.
- Selecting Last + Current 3 Weeks will return results for the last full 2 weeks preceding the 14th, plus the week that contains the 14th.
Next allows you to specify a future time interval and follows the same logic as the Last option. Choose the Next + Current option to include the current day, week, month, etc., in your results.
Tip: The tile will show the actual date(s) corresponding to your selection (e.g., "01-Jan-2019 to 31-Jan-2019," "From 01-Jan-2019," etc.).
Related Topics and Links
- SEP Dashboards
- Actions and Messages Tiles
- FMEA Tiles
- Metrics and Report Tiles
- Projects Tiles
- FRACAS Tiles