FMEA Tiles
The SEP dashboard offers several convenient tiles for viewing FMEA data. They help you monitor the potential failure causes identified in your FMEAs and track the progress of actions that are being taken to reduce risk. These tiles include:
Choose FMEAs to Display
You can configure tiles to show data from all FMEAs in a given project, or you can show data from one or more selected FMEAs.
- Open the Settings dialog box and select a project:
- Choose Active or Selected from the Project drop-down list.
- If you choose the Selected
option, click the Add
icon,
 ,
to select a project. (See Tile
Settings.)
,
to select a project. (See Tile
Settings.) - Select one or more FMEAs:
- Choose Selected from the FMEA drop-down list.
- Click the Add
icon, .
- In the Add FMEA dialog box, select the FMEAs you wish to display from the hierarchy.
Note: Only parts or processes with FMEAs will have check boxes.
- Click OK and OK again to save your configuration.
Choose Stats to Display
For some FMEA tiles, you must select which stats to display and specify their order.
- Open the Settings dialog box.
- In the Stats to show
area, click the Add
icon, .
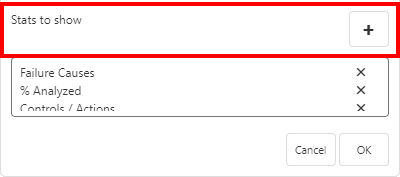
- Select the stats you wish to display.
- If applicable, enable the Show trend option and specify a date range. (See Selecting a Date Range.)
- To change the order of the stats, drag them to the
desired position using the handle,
 .
. - Click OK to close the Add Stat dialog box. The stats should now appear in the Settings dialog box.
- Click OK to save all your changes and close the Settings dialog box.