FMEA Stats Grid Tile
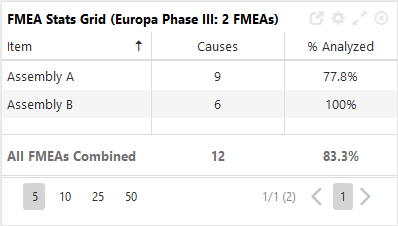
The FMEA Stats Grid allows you to monitor selected stats for multiple FMEAs in a project within a single tile. It offers the same stats that are available in the FMEA Stats tile (except for "Risk Profile with Actions") but breaks them down by individual FMEA.
All FMEAs Combined
The row at the bottom of the grid shows the stats for All FMEAs Combined. Note that these combined stats consider unique records (see FMEA Stats tile). If the same resources and/or linked FMEAs appear multiple times within the combined data set, the values in this row will differ from the sum of the stats for the individual FMEAs. For example, in the grid shown below, “Assembly A” and “Assembly B” each include three causes from the same linked FMEA. Since these causes are counted only once, the value shown for the combined data set is 12, not 15.

- To select a different project and/or FMEAs, see "Choose FMEAs to Display."
- To select stats, see "Choose Stats to Display."
Note: For this tile, you must specify the order of the columns in the Settings dialog box.
% Reduction in RPN
If you choose to display % Reduction in RPN, the tile will include three columns — Total Initial RPN, Total Current RPN and % Reduction in RPN — assuming both the initial and revised RPN options have been enabled in the project. Dashes appear in grid cells in cases where no value has been assigned or when the % reduction cannot be calculated. See "% Reduction in Total RPN" for more information.

Risk Profile
If you choose to display Risk Profile (Revised / Current), you can enable the Show trend option to show the changes from the initial risk rankings in the All FMEAs Combined row. (See "Risk Profiles — Initial and Revised / Current" for more information.)