BlockSim Version 2022 Online Help
 Using Event Analysis Flowcharts
Event analysis flowcharts (formerly RENO flowcharts) are used
to build models of probabilistic or deterministic problems, processes
or scenarios in order to help you understand and/or quantify them.
The flowchart is a graphical representation of the mathematical
process of predicting an outcome.
The example that follows demonstrates some of the basic techniques
used in working with event analysis flowcharts. This simple flowchart
generates failure times for 10 items.
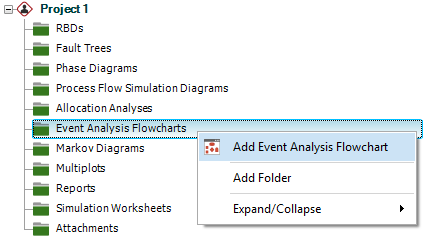
 Add diagram
Right-click the Event Analysis Flowcharts folder in
the current project explorer and choose Add
Event Analysis Flowchart.
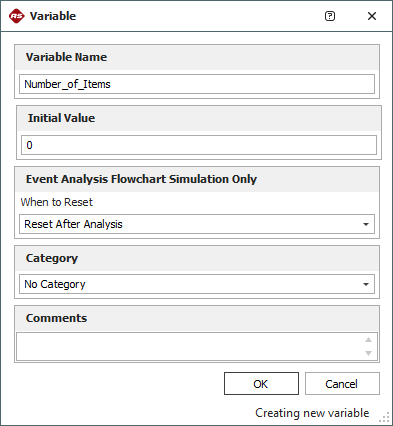
- Define resources
- Create
a variable
This resource will control
the number of items to generate failure times for.
Choose Home >
ReliaSoft > Resource Manager.

In the Resource Manager, choose
Variables
and then choose Home
> Edit > Add.
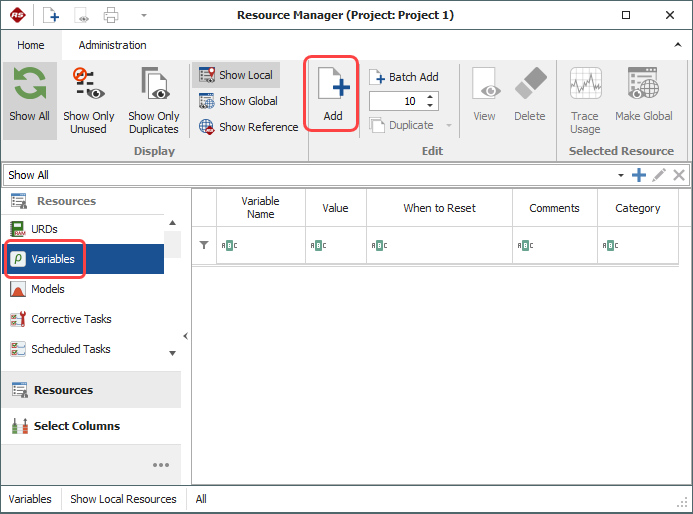
Define the variable properties.
(See Variables.)
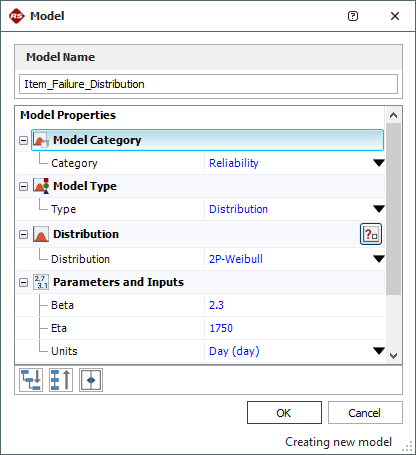
- Create
a model
This resource will define
the model used to generate the failure times.
In the Resource Manager, choose
Models
and then choose Home
> Edit > Add.
Define the model properties.
(See Models.)
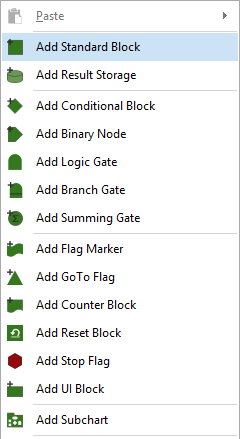
- Add blocks (See
Flowchart Block Types.)
- Add
a standard block (to increment the variable)
This block will increment
the value of the Number_of_Items variable.
Right-click inside the diagram and choose to add
a standard block.
(See Flowchart Standard
Blocks.)
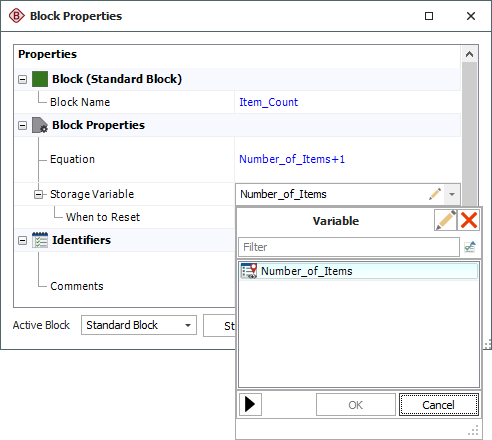
To edit the block's properties, right-click it and
choose Block Properties.
Click inside the Equation field
and type Number_of_Items
+ 1.
(For additional tools to assist with building equations,
see Function
Selector and Equation Editor.)
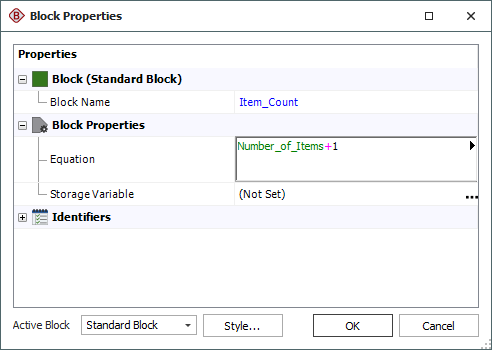
Click inside the Storage
Variable field and select the
Number_of_Items
variable.
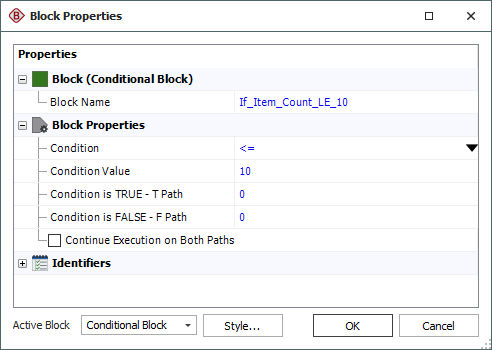
- Add
a conditional block (i.e., create an IF statement)
This block will determine
the simulation path based on whether the item count
has reached 10.
Right-click inside the diagram and choose to add
a conditional block.
(See Conditional Blocks.)
In the block's properties window, specify that if
the incoming value is less than or equal to 10, a
value of 0 will be passed on the "true"
path. Otherwise, a value of 0 will be passed on the
"false" path.
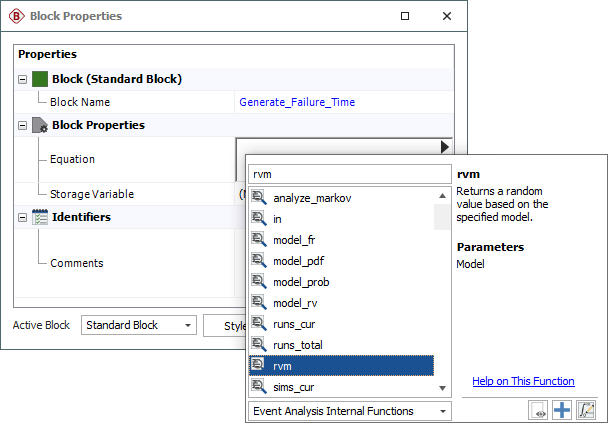
- Add
a standard block (to generate the failure times)
This block will generate
a failure time by returning a random value based on
the Item_Failure_Distribution model.
In the block's properties window, right-click inside
the Equation
field, choose Show
Function Selector then choose
Event
Analysis Internal Functions from the drop-down
list. Double-click the rvm
function.
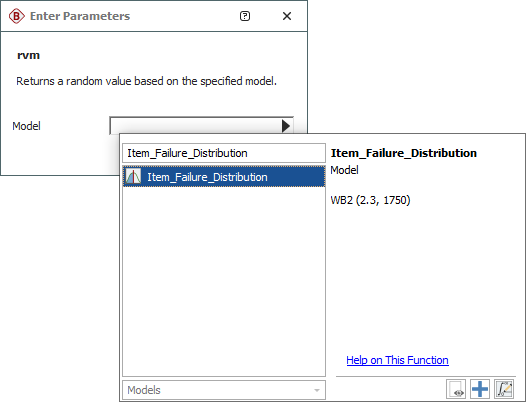
In the Enter Parameters window that appears, right-click
in the Model
field and open the Function Selector. Double-click
the Item_Failure_Distribution
model.
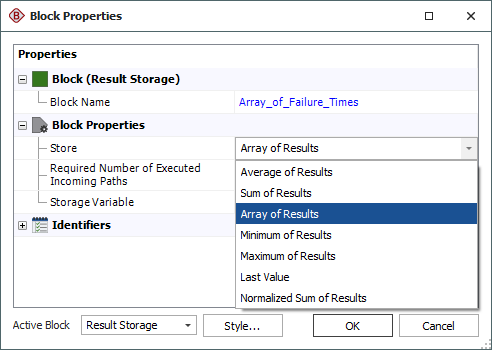
- Add
a result storage block
This block will store
an array of the failure times generated by the standard
block.
Right-click inside the diagram and choose to add
a result storage block.
(See Result Storage Blocks.)
In the block's properties window, specify that it
will store an array of results.
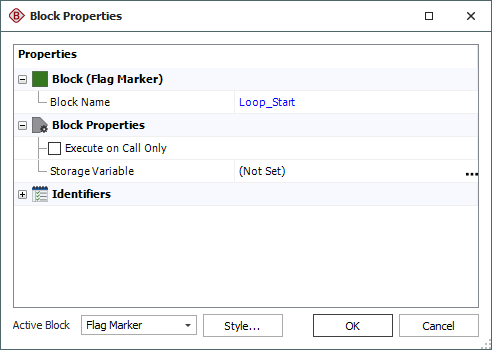
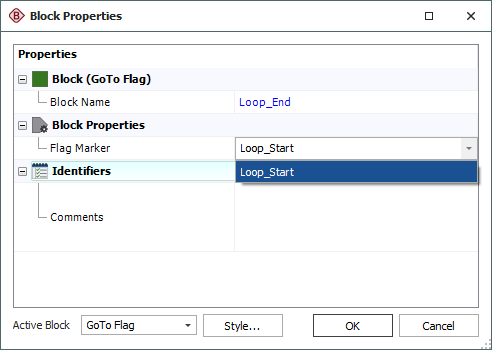
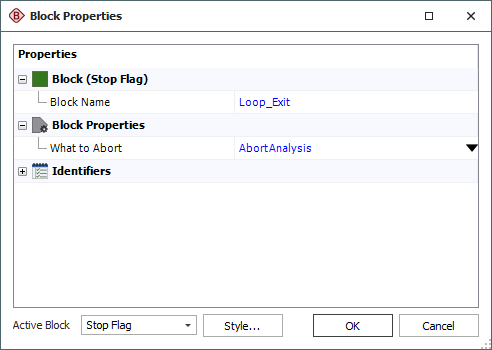
- Create
a FOR loop
These blocks will form
a loop that will cycle through the flowchart until
the variable value reaches 10.
Add a flag marker block, a go-to-flag block and
a stop flag.
Define the properties.
(See Flag Marker and Go-to-Flag
Blocks
and Stop Flags.)
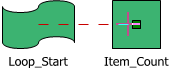
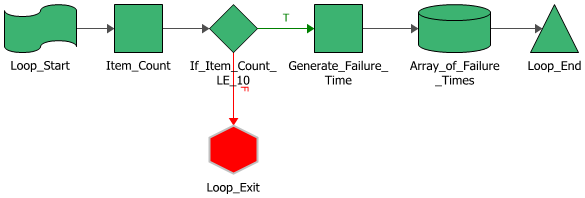
- Connect blocks
Connect the blocks as shown below. To create each connection,
hold down the ALT
key, click the source block and drag a line to the destination
block.
The first connector you create from the conditional
block will be marked as the "true" path and
the second as the "false" path. If necessary,
you can switch these designations by right-clicking the
connector and choosing Set
to Failure or Set
to Success on the shortcut menu.
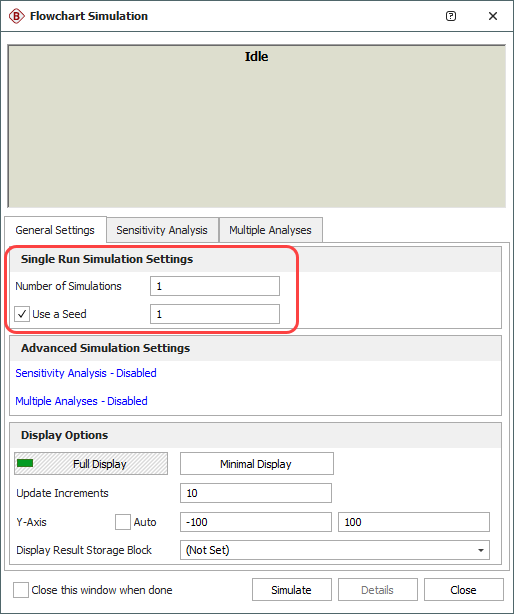
- Simulate the flowchart
Click the Simulate
icon on the control panel.

Specify to run a single simulation with a seed of 1
and click Simulate.
(See Flowchart Simulation
Window.)
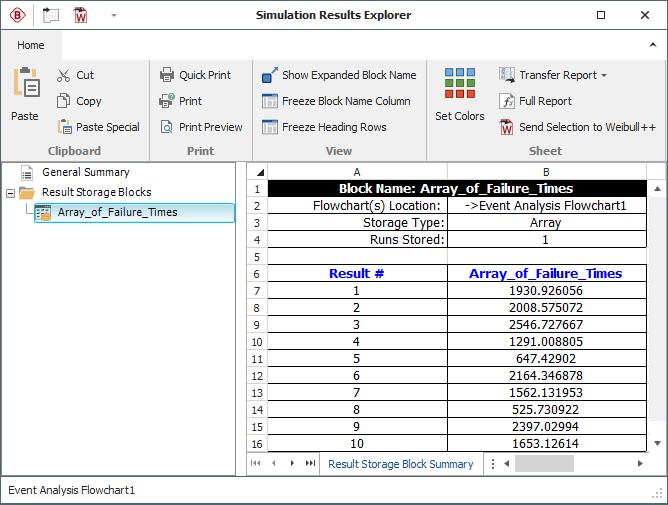
- View the simulation results
From within the Flowchart Simulation Window, click Details. If you have
closed the window, click the Results
valid as of field on the diagram control panel.
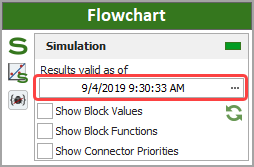
To view the failure times generated during the simulation,
click the result storage block in the navigation panel.
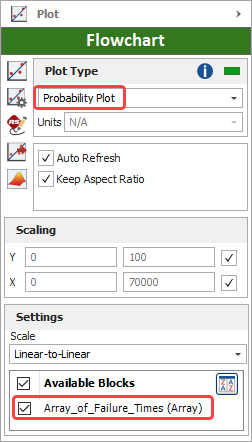
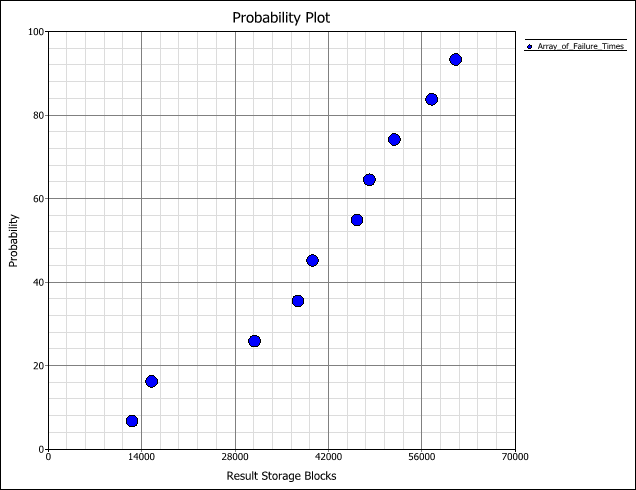
- View plots
Click the Plot
icon on the diagram control panel to open the plot sheet.
(See Flowchart Plots
for available plot types.)

On the plot sheet control panel, choose the plot type,
then select the result storage block(s) to show in the
plot.