Quick Calculation Pad (QCP)
The Quick Calculation Pad (QCP) provides a convenient way of calculating a variety of useful metrics. You can access the tool by clicking the QCP icon on the Analytical or Simulation page of the diagram control panel.
![]() or
or ![]()
The following example shows the QCP for analytical diagrams.

This topic provides a general description of the QCP and how to use it in most analyses. For more focused information about the types of calculations that can be performed for an analytical diagram, see Analytical Quick Calculation Pad. For information about the types of calculations available for simulation diagrams and phase diagrams, see Simulation Quick Calculation Pad. For information about the types of calculations available for Markov diagrams, see Markov Quick Calculation Pad.
How to Use the QCP
To use the QCP, do the following:
- Choose a metric in the Calculate area.
- If applicable, use the Units drop-down list to specify the units for time values that are entered as inputs and/or displayed as results. The units in the QCP can be different from the units that were used for the diagram. For example, you could enter the age of the block in hours but then calculate the reliability for 1 year of operation — the application will convert the times automatically based on the conversion factors specified for the database.
- For analytical diagrams, use the Bounds drop-down list to specify what type of confidence bounds to calculate. The following graphics illustrate the types. The ReliaWiki resource portal provides more information on the background theory of confidence bounds at: http://www.reliawiki.org/index.php/Confidence Bounds.
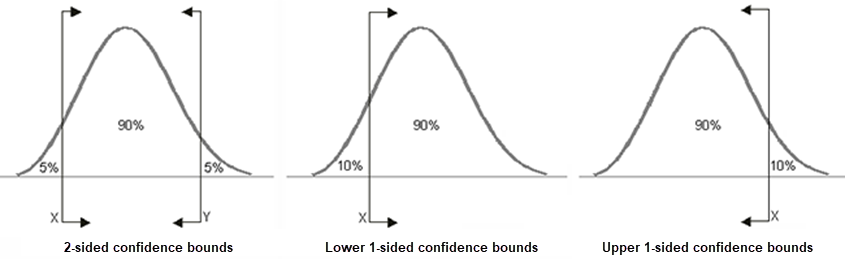
If you select Both One-Sided, the QCP will calculate both the lower one-sided bound and the upper one-sided bound.
Note: Confidence bounds are available only in cases where all blocks that can fail in the analytical diagram use models that have Fisher matrix bounds. To have Fisher matrix bounds, a model must have been created by publishing from a data source, such as a Weibull++ data sheet, that was calculated using Fisher matrix bounds. Bounds are not available if the diagram has containers or mirrored blocks, or if any block uses the cumulative damage model. Bounds are also unavailable if the diagram has subdiagrams, unless the diagram and all subdiagrams are analytical fault trees using the BDD analysis type.
- Make any required inputs in the Input area.
- Click Calculate.
The calculated value(s) will always be displayed in the results
area at the top of the window, and clicking the Report
button displays a summary of the current calculation input/output
in the Results window. You
can also use the Options
drop-down list to configure other settings, including:
- Precision sets the number of decimal places displayed in the results.
- Scientific Notation sets the point at which numbers will be converted to normalized scientific notation. For example, setting this to 3 means that all numbers with a value of 1,000 or more will be converted to normalized scientific notation (e.g., 1.0E+3).
- Set Display Font allows you to change the font style and size that is used to display the calculated value(s) in the results.
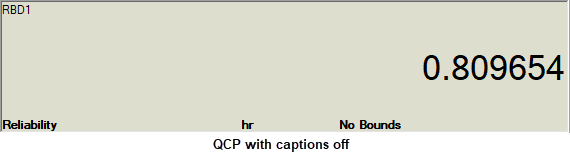
- Select Captions if you want additional information to be displayed in the results area along with the values (a green light in the button indicates that this option is selected). For example, if you have selected to calculate the reliability for a given period of time, the first picture shows the display with captions and the second picture shows without.

-
Select Show Calculation
Log if you want to display a log on the right side
of the window that records some or all of the calculations
performed during this QCP session (a green light in the
button indicates that this option is selected).
- If Auto Print Results is selected under Options, all results will be automatically printed to the log each time you perform a calculation.
- Otherwise, you can choose which results to add to the log by using the Print button at the bottom of the log display.
Under the log display, you can also click Feed to "advance the tape" or Clear to delete all data from the current log. If you click inside the log, you can copy some or all of the text to the Clipboard.
- Select Non-Modal QCP to lock the QCP in a top window position so it can remain open while you have access to all diagrams. The calculations performed in the QCP will be based on the currently active diagram. If this option is not selected, you will need to close the QCP to access any diagram. This setting can also be changed using the While QCP is open, have access to all folios option on the Other Settings page of the Application Setup.