Flowchart Simulation Window
To simulate an event analysis flowchart, choose Simulation > Simulation > Simulate or click the Simulate icon.
![]()
Tip:
The following terms apply to simulating event analysis flowcharts:
A simulation
is a single pass through the flowchart. Note that this may pass
through blocks multiple times if your flowchart includes one or
more loops.
A run
is a set of simulations.
An analysis
is a set of runs.
When simulating, you have three basic choices of what to do:
- Perform a single run, consisting of anywhere from 1 to 100,000,000 simulations.
- Perform a sensitivity analysis, which involves varying either one or two variables and performing a run at each setting. This allows you to evaluate the effect of each of the variables on the results.
- Perform multiple analyses, which involves performing multiple sensitivity analyses in order to minimize or maximize the value of a specified result storage block.
The area at the top of the Flowchart Simulation window displays the status of the simulation. For information on configuring this display, see Flowchart Simulation Status Display.
During simulation, you can click Cancel to stop the simulation at the current point. The results will be provided for the simulations (if any) that were completed before you stopped the process. When simulation is complete, you can click the Details button to view the results of the simulation in the Results Explorer. Click the Simulate button to re-run the simulation.
Note: Once you have simulated a flowchart, the settings you have specified in the Flowchart Simulation window are saved along with the diagram so that you or another user can easily simulate the flowchart again using the same settings. The first time you simulate a flowchart, the settings default to the settings used for the last simulation that was performed on your computer.
Performing a Single Run
To perform a single run, you will need only the settings on the General Settings tab of the window. First, specify the Number of Simulations that you want the run to consist of.
If you need your results to be repeatable, select the Use a Seed check box and enter a seed, which specifies a starting point from which the random numbers used in simulation will be generated. The same random numbers and, therefore, the same simulation results will be generated when the same seed value is used.
In the Advanced Simulation Settings area, make sure that both sensitivity analysis and multiple analyses are disabled, then click Simulate.
Performing a Sensitivity Analysis
Sensitivity analysis allows you to evaluate the effect of one or two variables on the results by performing a run at each of a range of settings.
To perform a sensitivity analysis, first specify the settings for each run on the General Settings tab of the window.
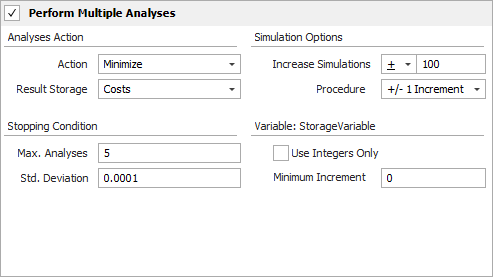
On the Sensitivity Analysis tab, specify whether you want to modify one or two variables by selecting either the One Way check box or both the One Way and Two Way check boxes. In each case, choose the variable from the Variable drop-down list, then specify the range of settings for the variable. The Start value will be used in the first run. The End value is the maximum value that can be used in the simulations; the largest value used will be less than or equal to this. Increment by is the amount by which the start value will be increased for each subsequent run.
These settings determine how many runs will be performed. For example, let's say that the number of simulations specified on the General tab is 1,000. You select the One Way check box and, for a selected variable, you enter a Start value of 100, an End value of 500 and an Increment by value of 100, as shown next.
With these settings, the 1,000 simulations will be run with the variable valued at 100, again with it valued at 200, again at 300 and so on until they have been run with the variable at its maximum value of 500. In this case, that would mean that the analysis will consist of 5 runs, with 1,000 simulations performed for each run.
Note: In the Variable drop-down list, you can also choose to vary the number of simulations performed or the seed used.
Performing Multiple Analyses
You can perform multiple sensitivity analyses in order to minimize or maximize the value of a result storage block. When performing multiple analyses, the software performs the first sensitivity analysis and finds the value of the variable at which the result storage block of interest is either lowest or highest (depending on whether you are minimizing or maximizing the value). It then takes an interval surrounding that value, divides it up according to the increment specified for sensitivity analysis and performs the specified number of runs on that interval. This process is repeated until specified stopping conditions are reached, refining the interval and the minimum/maximum result with each analysis.
To perform multiple analyses, first specify the settings for each run on the General Settings tab of the window, then specify the sensitivity analysis settings.
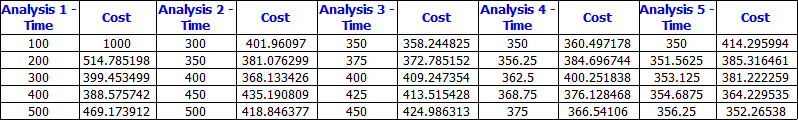
On the Multiple Analyses tab, select the Perform Multiple Analyses check box, then specify the following settings:
- In the Analyses Action area, choose the Result Storage block that you want to work with, and the Action you want to perform on it (i.e., whether you want to minimize or maximize the value of the selected result storage block). Note that you cannot choose a result storage block that is set to store an array of values.
- In the Simulation Options
area:
- Use the Increase Simulations field to specify a number by which the number of simulations is either incremented or multiplied for each consecutive sensitivity analysis. Click the operator (+ or x) to toggle between incrementing and multiplying. This option allows you to, for example, perform more simulations at each consecutive analysis so that early analyses over a broad range take less time, while final analyses are performed in detail.
- In the Procedure field, specify how to calculate the range for each consecutive analysis. For instance, if you choose +/- 2 Increments, then the software will take the "best" value of the variable from the most recent analysis (i.e., the one that yields the most desirable result for the result storage block) and, for the next analysis, will use a range that spans from two increments below that value to two increments above it. The increments are those used in the previous analysis.
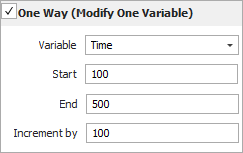
For example, let's assume that you use the sensitivity analysis settings specified above (i.e., variable = Time, start = 100, end = 500, increment = 100) and the multiple analyses settings shown next.
The results of the simulation are shown next.
With these settings, Analysis 1 consists of runs performed with the Time variable at 100, 200, 300, 400 and 500. The minimum value for the Costs variable in the first analysis is found at 400. The range for Analysis 2 is +/- 1 increment around 400 (i.e., 300 - 500), and that range is divided into the same number of steps used in the previous analysis. The minimum value for the Costs variable in the second analysis is found at 400. The range for Analysis 3 is +/- 1 increment around 400, where the increment is the one used in Analysis 2 (i.e., +/- 50, yielding a range of 350 - 450). This continues until the stopping condition is reached, as explained next.
- In the Stopping Condition area, enter the maximum number of sensitivity analyses that will be run in the Max. Analyses field. In the Std. Deviation field, enter the convergence threshold at which the result is considered accurate enough. Simulation will stop when the standard deviation is reached or when the maximum number of analyses have been performed, whichever comes first.
For each variable being modified in the sensitivity analyses, you can select the Use Integers Only check box to ensure that the analyses will use only integer values of the variable. You can also specify a Minimum Increment that can be used to determine the values of the variable for the analyses. Consider the multiple analyses example above. In Analysis 5, the range of values for the variable is 350 - 356.25. Suppose, however, that you can adjust Time only to a 10-hour window. If you specify a minimum increment of 10, you obtain the results shown next.