Flowchart Simulation Status Display
The area at the top of the Flowchart Simulation window displays the status of the simulation.
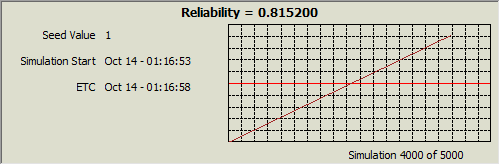
The following numerical information is always shown:
- Seed Value displays the seed value used, if any (i.e., the starting point from which the random numbers used in simulation are generated).
- Simulation Start displays the date and time that the simulation began.
- ETC displays the expected date and time of completion for the simulation.
In addition, the current number of simulations performed out of the total number of simulations scheduled to be performed is shown at the bottom of the simulation status display (e.g., 10 out of 100 simulations). You can control how often this number is updated by specifying the number of increments to divide the total number of simulations into in the Update Increments field in the Display Options area.
If you have selected Full Display in the Display Options area, a plot will also be shown in the simulation status display. This plot shows the value of the result storage block that you have chosen from the Display Result Storage Block drop-down list. Result storage blocks of all types except array will be available in this list. The range of values represented on the y-axis is controlled by your entries in the Y-Axis fields. During simulation, the current value of the selected result storage block is displayed above the plot.